- ADA price is facing a strong resistance near the $0.0445 and $0.0450 levels against the US Dollar.
- The price is likely to break the $0.0425 support and it could correct lower.
- There is a connecting bullish trend line forming with support near $0.0430 on the 4-hours chart (data feed via Kraken).
- The price could bounce back as long as there is no close below $0.0405 and $0.0400.
Cardano price is currently correcting lower against the US Dollar and bitcoin. ADA price might extend its correction before a fresh increase towards $0.0480.
Cardano Price Analysis
In the past few sessions, cardano price mostly gained pace after tagging the $0.0412 support against the US Dollar. The ADA/USD pair traded higher and broke the $0.0425 and $0.0440 resistance levels.
Moreover, the price settled above $0.0425 and the 55 simple moving average (4-hours). However, the price seems to be facing a strong resistance near the $0.0445 and $0.0450 levels. The recent high was near $0.0445 and the price is currently declining.
It traded below the $0.0440 level, plus the 23.6% Fibonacci retracement level of the upward move from the $0.0411 low to $0.0445 high. An immediate support is near the $0.0430 level and the 55 simple moving average (4-hours).
Additionally, there is a connecting bullish trend line forming with support near $0.0430 on the 4-hours chart. Below, the trend line, the 50% Fibonacci retracement level of the upward move from the $0.0411 low to $0.0445 high is at $0.0428.
The main support area is near the $0.0425 (the previous resistance area). It also coincides with the 61.8% Fibonacci retracement level of the upward move from the $0.0411 low to $0.0445 high.
If there is a downside break below the $0.0425 support, cardano price could decline further. The next major supports are near the $0.0405 and $0.0400 level. Any further losses might push the price into a bearish zone towards $0.0365.
On the upside, the main hurdles are near the $0.0445 and $0.0450 levels. If there is a successful close above $0.0450, the price could continue to rise towards the $0.0465 and $0.0480 resistance levels.
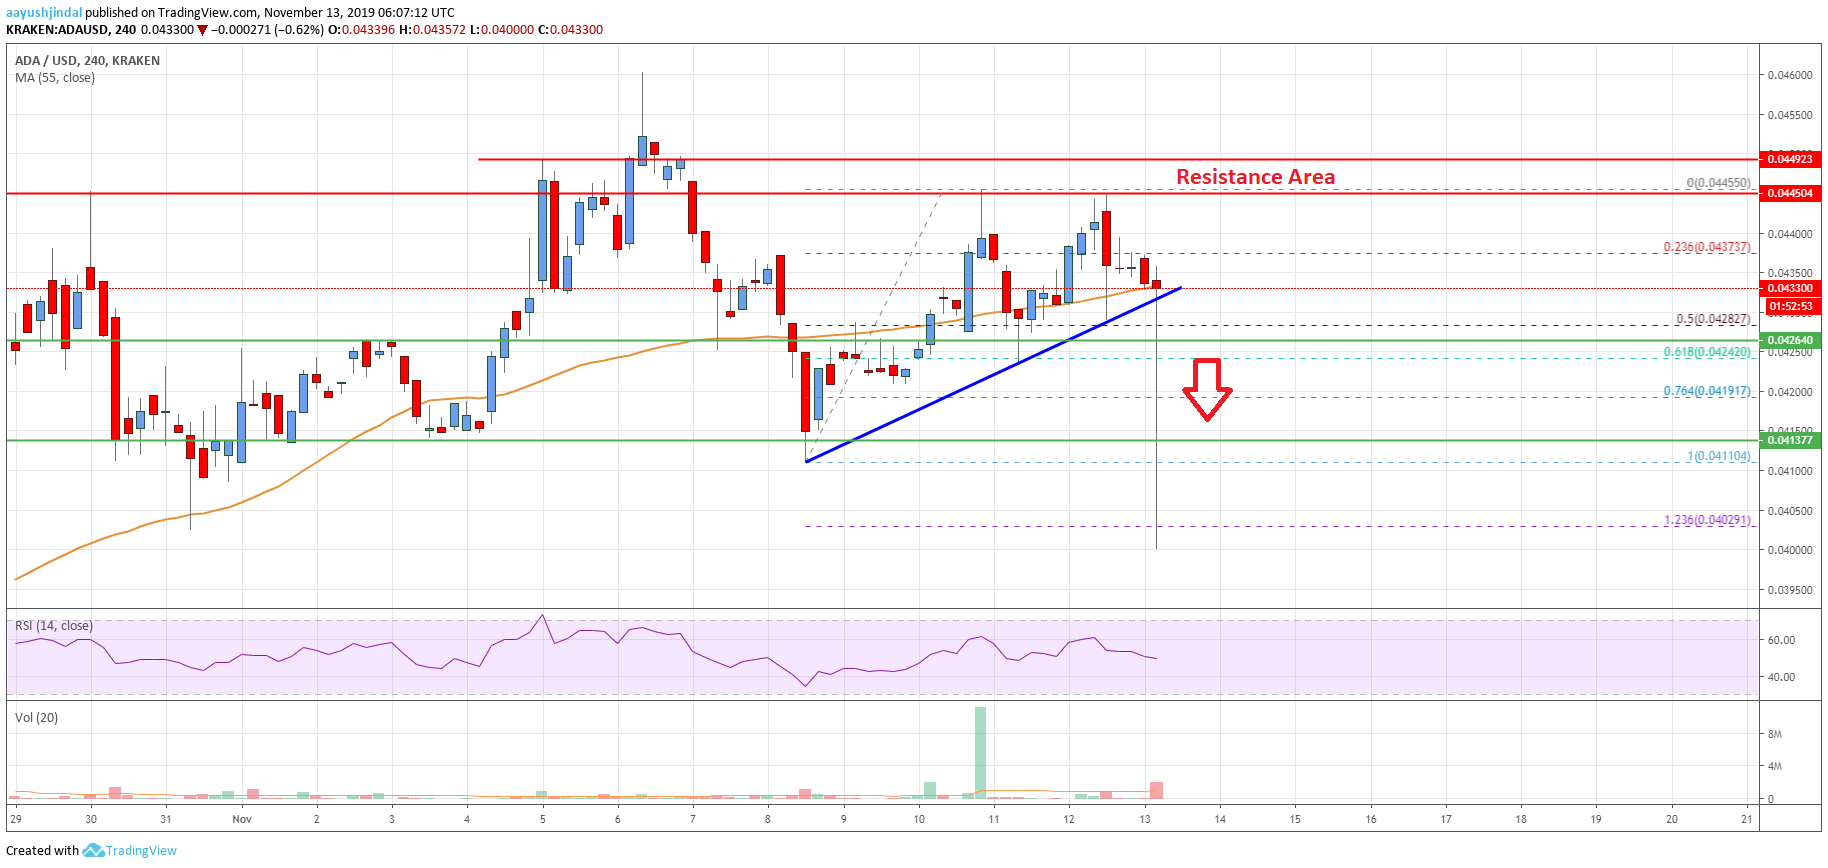
The chart indicates that ADA price is clearly struggling to surpass the key $0.0445 and $0.0450 resistance levels. If it continues to struggle, there is a risk of a downside break below $0.0425. Having said that, the price is likely to find a solid buying interest near $0.0405 or $0.0400.
Technical Indicators
4 hours MACD – The MACD for ADA/USD is losing momentum in the bullish zone.
4 hours RSI – The RSI for ADA/USD is currently declining and is near the 50 level.
Key Support Levels – $0.0425 and $0.0405.
Key Resistance Levels – $0.0445 and $0.0450.
