
- ADA price started a sharp decline from the $2.60 zone against the US Dollar.
- The price is now trading below $2.50 and the 55 simple moving average (4-hours).
- There is a crucial bearish trend line forming with resistance near $2.35 on the 4-hours chart (data feed via Bitfinex).
- The price could remain in a bearish zone as long as it is below the $2.35 resistance zone.
Cardano price is down over 10% and it broke the $2.20 support against the US Dollar, similar to bitcoin. ADA price must clear $2.35 to start a fresh increase.
Cardano Price Analysis
After struggling to clear the $2.65 zone, cardano price started a major decline against the US Dollar. The ADA/USD pair broke the $2.50 support to move further into a bearish zone.
The price even broke the $2.20 support level and settled below the 55 simple moving average (4-hours). Finally, there was a spike below the $2.00 level. A low was formed near $1.973 before the price recovered higher. There was a wave above the $2.00 and $2.05 levels.
The price also surpassed the 23.6% Fib retracement level of the recent decline from the $2.58 swing high to $1.97 low. An immediate resistance on the upside is near the $2.20 level.
The first major resistance is forming near the $2.35 level. There is also a crucial bearish trend line forming with resistance near $2.35 on the 4-hours chart. The trend line is close to the 50% Fib retracement level of the recent decline from the $2.58 swing high to $1.97 low.
If there is an upside break above the $2.35 zone, the price could rally above $2.40. The next major resistance could be near the $2.50 level. On the downside, an immediate support is near the $2.05 level. The main support sits near the $2.00 level. Any more losses might call for a sharp decline to $1.85 in the near term.
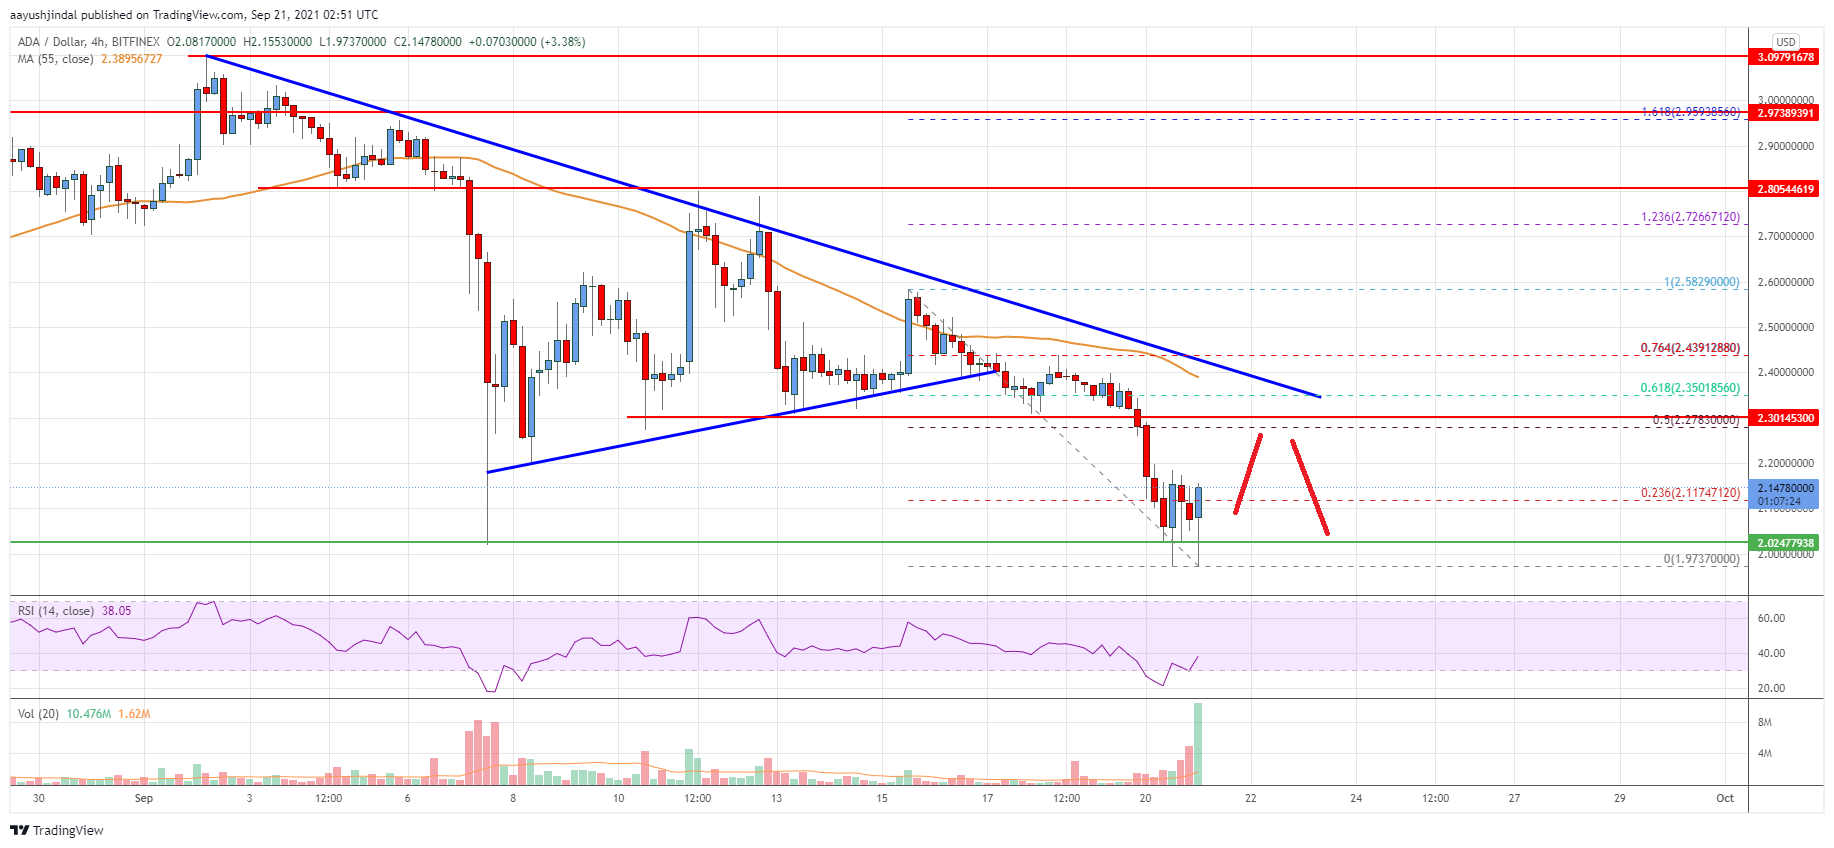
The chart indicates that ADA price is now trading below $2.20 and the 55 simple moving average (4-hours). Overall, the price could remain in a bearish zone as long as it is below the $2.35 resistance zone.
Technical Indicators
4 hours MACD – The MACD for ADA/USD is still in the bearish zone.
4 hours RSI – The RSI for ADA/USD is now well below the 50 level.
Key Support Levels – $2.05 and $2.00.
Key Resistance Levels – $2.20 and $2.35.


Leave a Reply
You must be logged in to post a comment.