
- ADA price started a strong increase above the $1.0 resistance against the US Dollar.
- The price is now trading above $1.05 and the 55 simple moving average (4-hours).
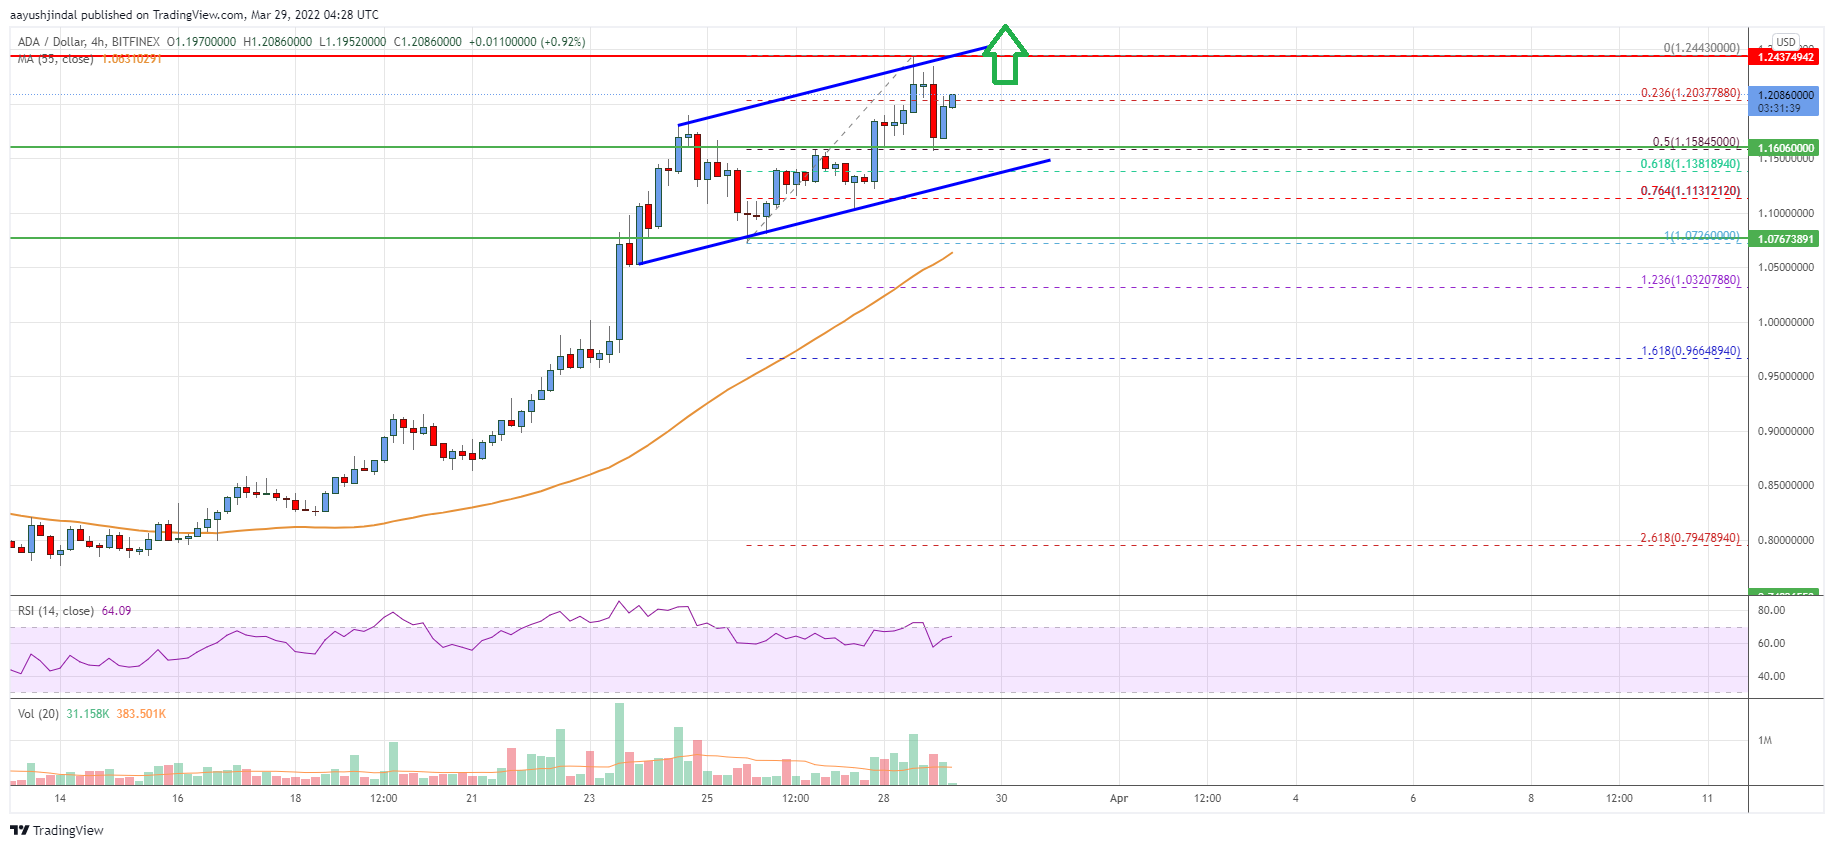
- There is a key rising channel forming with support near $1.150 on the 4-hours chart (data feed via Bitfinex).
- The price could correct lower, but dips might be limited below $1.150.
Cardano price is surging above $1.15 against the US Dollar, similar to bitcoin. ADA price could continue to rise if there is a clear move above the $1.24 level.
Cardano Price Analysis
This week, cardano price saw a fresh increase from the $0.850 support zone against the US Dollar. The ADA/USD pair broke the $0.88 and $0.95 resistance levels to move into a bullish zone.
There was a close above the key $1.0 resistance and the 55 simple moving average (4-hours). The bulls even pumped the price above the $1.15 level. A high was formed near $1.244 and the price is now consolidating gains.
There was a minor move below the 23.6% Fib retracement level of the upward move from the $1.072 swing low to $1.244 high. On the downside, an immediate support is near the $1.165 level. If there are additional losses, the price may perhaps dive towards the $1.15 support level.
There is also a key rising channel forming with support near $1.150 on the 4-hours chart. The channel support is near the 50% Fib retracement level of the upward move from the $1.072 swing low to $1.244 high.
A break below $1.15 could push the price towards the $1.05 level. On the upside, an immediate resistance is near the $1.232 level. The first key resistance might be near the $1.245 level. A clear upside break above the $1.245 level might send the price towards the $1.30 resistance.
The next key resistance might be near the $1.35 level. Any more gains could start a steady increase towards the $1.42 level in the near term.
The chart indicates that ADA price is now trading above $1.15 and the 55 simple moving average (4-hours). Overall, the price could correct lower, but dips might be limited below $1.150.
Technical Indicators
4 hours MACD – The MACD for ADA/USD is now gaining pace in the bullish zone.
4 hours RSI – The RSI for ADA/USD is now well above the 50 level.
Key Support Levels – $1.165 and $1.15.
Key Resistance Levels – $1.232 and $1.245.


Leave a Reply
You must be logged in to post a comment.