- ADA price corrected lower recently below the $0.0900 and $0.0850 supports against the US Dollar.
- The price traded close to the $0.0760 level and recently corrected above $0.0800.
- There is a significant bearish trend line in place with resistance at $0.0840 on the 4-hours chart (data feed via Kraken).
- The price must break the $0.0840 and $0.0850 resistance levels to start a strong uptrend.
Cardano price is currently trading below key resistances against the US Dollar and bitcoin. ADA is likely to accelerate higher if it clears the $0.0850 resistance zone.
Cardano Price Analysis
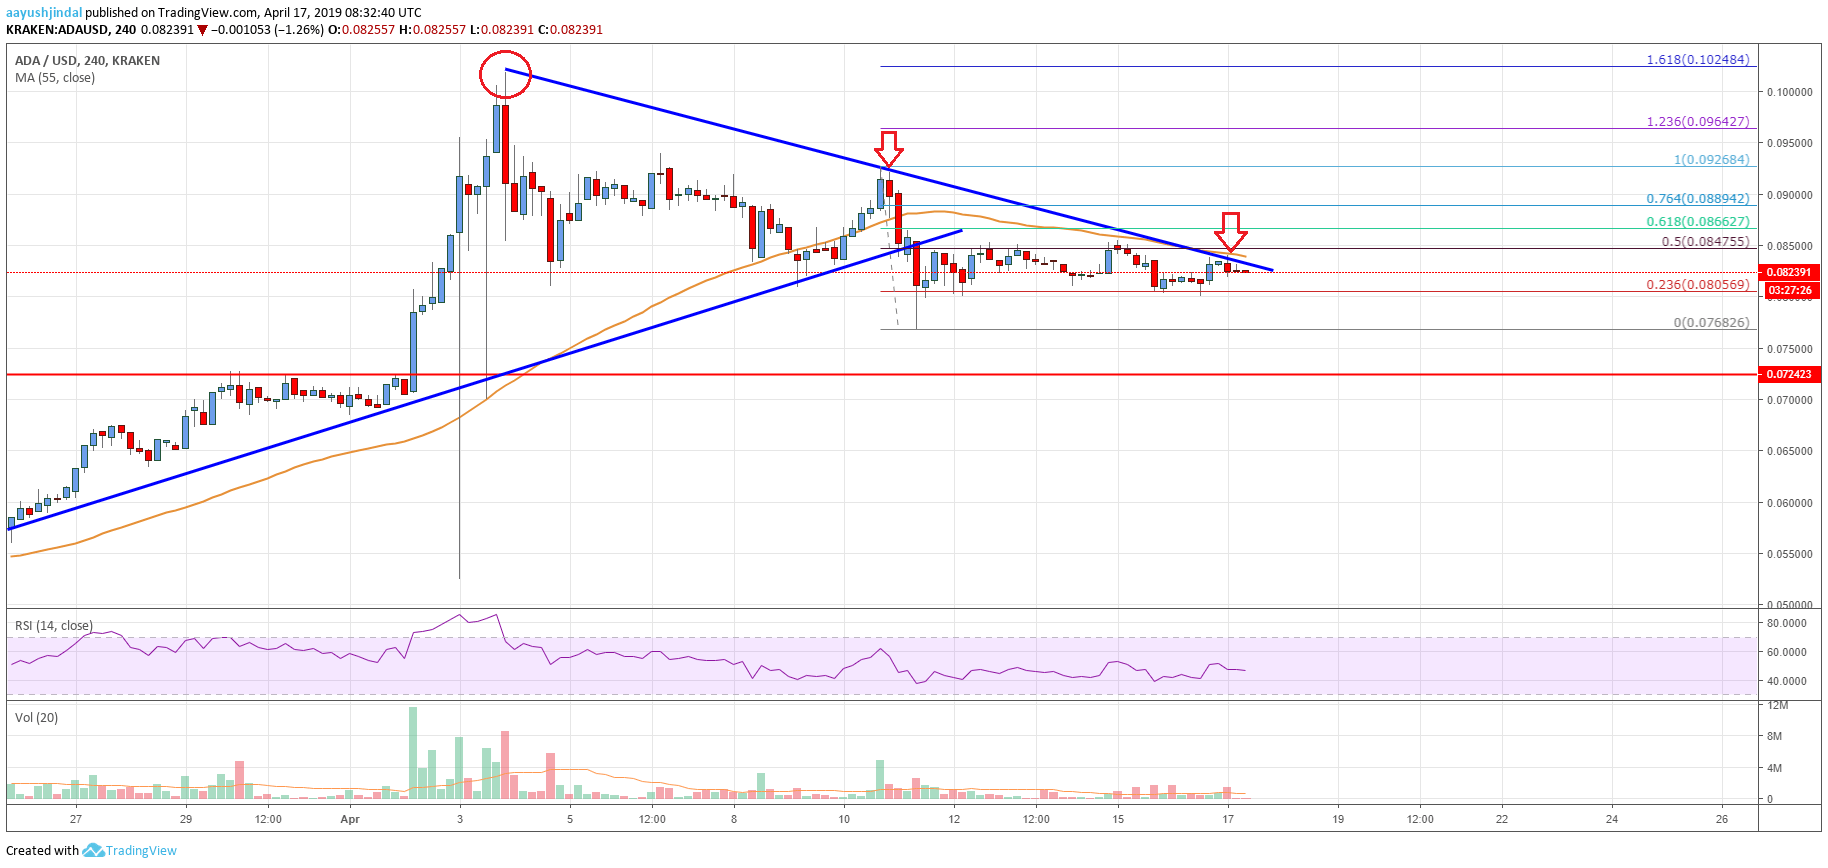
After trading towards the $0.1020 level, cardano price started a major downside correction against the US Dollar. The ADA/USD pair declined below the $0.0950 and $0.0920 support levels. Later, a swing high was formed at $0.0926 and the price declined sharply below $0.0850. There was a close below the $0.0850 level and the 55 simple moving average (4-hours). The price even broke the $0.0800 support and tested the $0.0760 level.
A new swing low was formed at $0.0768 and the price recently corrected higher. It broke the $0.0800 level and the 23.6% Fibonacci retracement level of the recent drop from the $0.0926 high to $0.0768 low. However, the upside move was capped by the $0.0850 level and the 55 simple moving average (4-hours). The price also failed near the 50% Fibonacci retracement level of the recent drop from the $0.0926 high to $0.0768 low. More importantly, there is a significant bearish trend line in place with resistance at $0.0840 on the 4-hours chart.
Therefore, cardano price must break the $0.0840 and $0.0850 resistance levels to start a fresh increase. The next main resistance above $0.0850 is near the $0.0925 swing high. An intermediate resistance is $0.0889 and the 76.4% Fibonacci retracement level of the recent drop from the $0.0926 high to $0.0768 low. If the price fails to clear the $0.0840 and $0.0850 resistance levels, it could resume its decline. An initial support is at $0.0805 and $0.0800.

The chart indicates that ADA price is facing a strong resistance near the $0.0840 and $0.0850 levels. A successful close above $0.0850 is likely to open the doors for a solid trend towards the $0.1000 level. Conversely, a break below the $0.0800 support may call for more losses. The next major support is near the $0.0760 and $0.0755 levels.
Technical Indicators
4 hours MACD – The MACD for ADA/USD is still placed in the bearish zone, with a few positive signs.
4 hours RSI – The RSI for ADA/USD is well below the 50 level and it might test the 40 level before it could rise.
Key Support Levels – $0.0805 and $0.0800.
Key Resistance Levels – $0.0840 and $0.0850.


Leave a Reply
You must be logged in to post a comment.