- ADA price surged higher recently and broke the $0.0500 resistance against the US Dollar.
- There is a crucial bullish trend line in place with support at $0.0475 on the 4-hours chart (data feed via Kraken).
- The price remains supported near $0.0475 and $0.0450 and it could soon resume bullish moves.
Cardano price is gaining bullish momentum and rallied recently against the US Dollar and Bitcoin. ADA remains buy on dips as long as there is no close below $0.0450.
Cardano Price Analysis
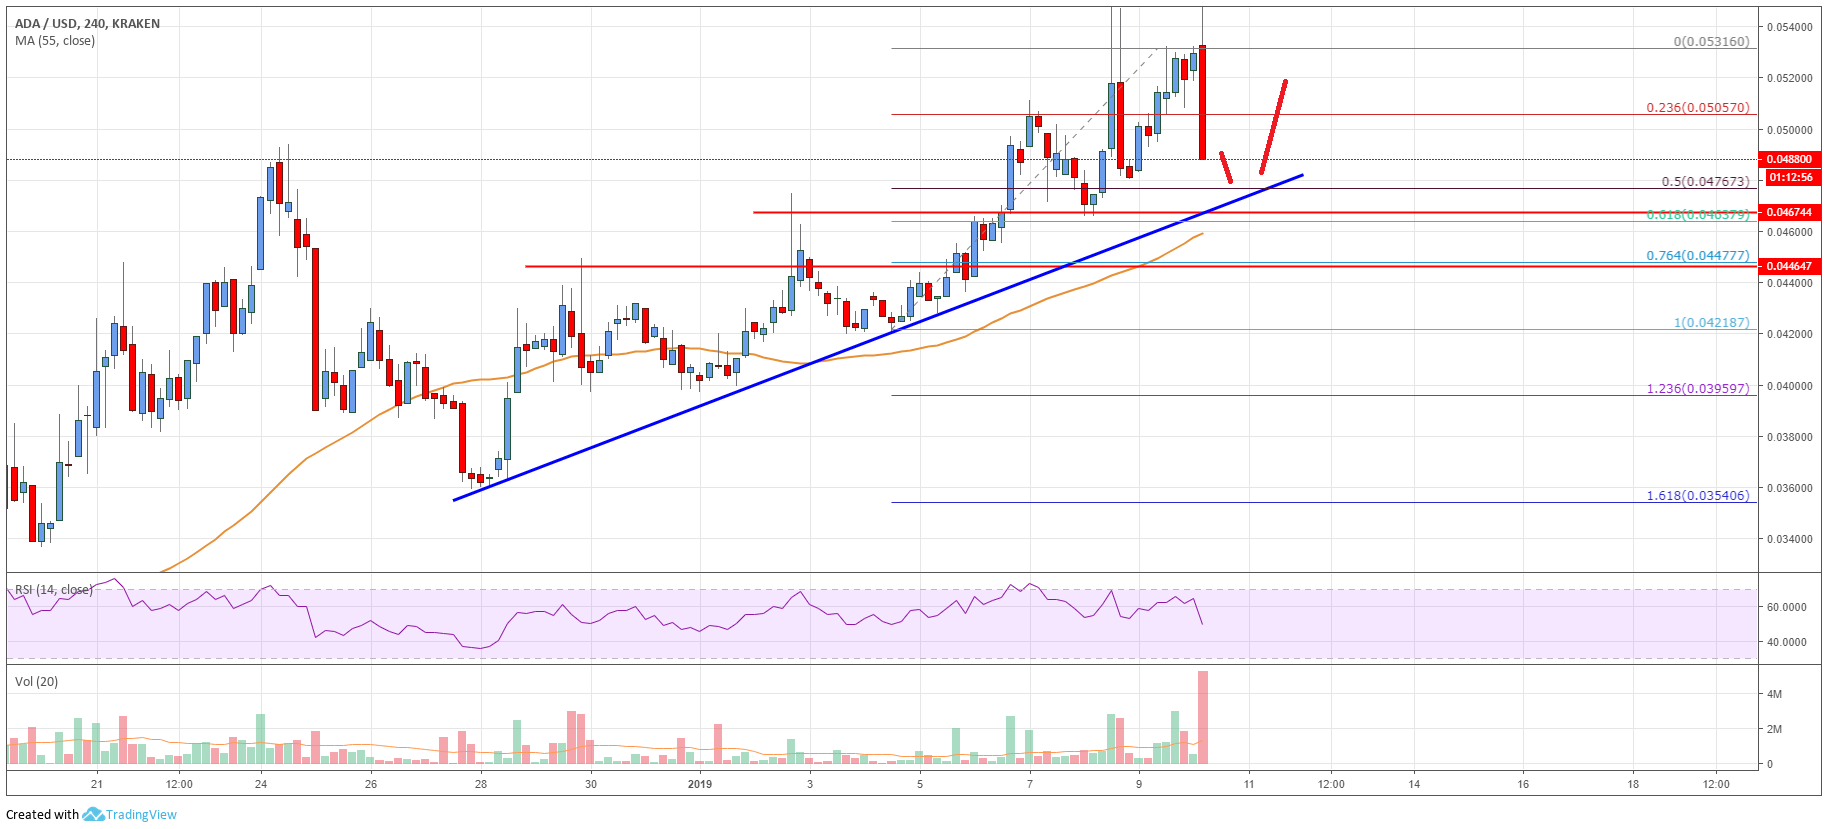
This week, there were heavy bullish moves from the $0.0420 support in cardano price against the US Dollar. The ADA/USD pair started a solid upward move and broke the $0.0450 and $0.0475 resistance levels. Buyers gained traction and pushed the price above the $0.0500 barrier and the 55 simple moving average (4-hours). The price spiked on a couple of occasions above the $0.0530 level and a swing high was formed at $0.0531.
Later, the price started a downside correction and traded below $0.0510. There was a break below the 23.6% Fibonacci retracement level of the last wave from the $0.0421 low to $0.0531 high. However, there are many supports on the downside near the $0.0480 and $0.0475 levels. Besides, the 50% Fibonacci retracement level of the last wave from the $0.0421 low to $0.0531 high is at $0.0476. More importantly, there is a crucial bullish trend line in place with support at $0.0475 on the 4-hours chart. Therefore, dips towards the $0.0475 level are likely to find a strong buying interest in the near term. If there is a break below $0.0475, the next key support is at $0.0450 and the 76.4% Fibonacci retracement level of the last wave.

The chart indicates that ADA price retreated from well above the $0.0530 resistance. However, there are many key supports near the $0.0475 and $0.0450 levels. On the upside, an initial resistance is at $0.0505 followed by $0.0520.
Technical Indicators
4-hours MACD – The MACD for ADA/USD is gaining pace in the bearish zone, with a negative bias.
4-hours RSI – The RSI for ADA/USD dipped sharply towards the 50 level, with a bearish angle.
Key Support Level – $0.0475
Key Resistance Level – $0.0505


Leave a Reply
You must be logged in to post a comment.