
- EOS price started a fresh decline from the $1.20 resistance against the US Dollar.
- The price is now trading just above $1.10 and the 55 simple moving average (4-hours).
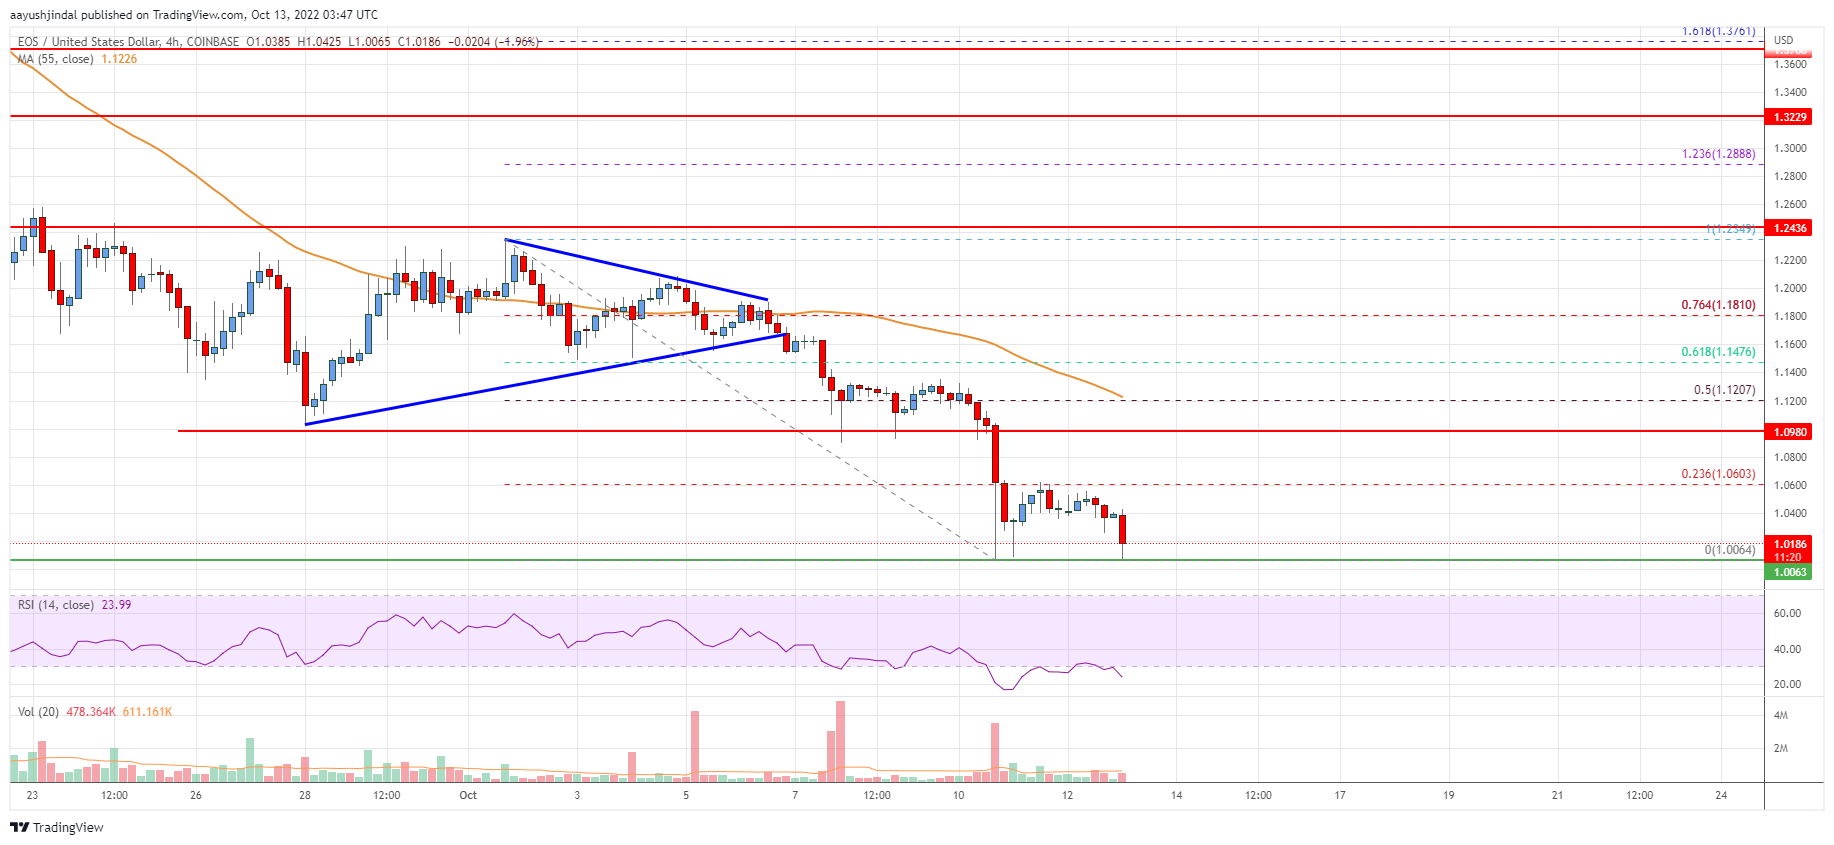
- There was a break below a major contracting triangle with support near $1.18 on the 4-hours chart of the EOS/USD pair (data feed from Coinbase).
- The pair could continue to move down if it stays below the $1.10 and $1.12 resistance levels.
EOS price is struggling below $1.20 against the US Dollar, similar to bitcoin. The price remains at a risk of a sharp decline below the $1.00 support.
EOS Price Analysis
This week, EOS price started a fresh decline from the $1.20 zone against the US Dollar. The price traded below the $1.15 and $1.12 levels to enter a bearish zone.
There was a break below a major contracting triangle with support near $1.18 on the 4-hours chart of the EOS/USD pair. The pair accelerated lower below the $1.10 support zone and settled well below the 55 simple moving average (4-hours).
The recent low was formed near $1.006 and the price is now consolidating losses. The price is now showing bearish signs below the $1.10 level, with a bearish angle. On the upside, an immediate resistance is near the $1.060 level. It is near the 23.6% Fib retracement level of the downward move from the $1.234 swing high to $1.006 low.
The next major resistance is near $1.10 or the 50% Fib retracement level of the downward move from the $1.234 swing high to $1.006 low or the 55 simple moving average (4-hours), above which it could test $1.15.
Any more gains might send the price towards the $1.20 level. On the downside, an immediate support is near the $1.00. The next key support is near the $0.980 level. If there is a downside break below the $0.980 support, the price could test the $0.920 support.
Looking at the chart, EOS price is now trading below the $1.15 level and the 55 simple moving average (4-hours). Overall, the price could continue to move down if it stays below the $1.10 and $1.12 resistance levels.
Technical indicators
4-hours MACD – The MACD for EOS/USD is gaining pace in the bearish zone.
4-hours RSI (Relative Strength Index) – The RSI is now well below the 50 level.
Major Support Levels – $1.000 and $0.980.
Major Resistance Levels – $1.06 and $1.10.


Leave a Reply
You must be logged in to post a comment.