- EOS price is recovering nicely from the $2.149 monthly low against the US Dollar.
- The price is up around 10% and it even tested the main $2.500 resistance area.
- There is a crucial bearish trend line forming with resistance near $2.480 on the 4-hours chart of the EOS/USD pair (data feed from Coinbase).
- The pair is likely to move into an uptrend if it settles above the $2.500 resistance area.
EOS price is showing a lot of positive signs against the US Dollar, just like bitcoin. Still, the price must surpass the $2.500 hurdle to continue higher in the near term.
EOS Price Analysis
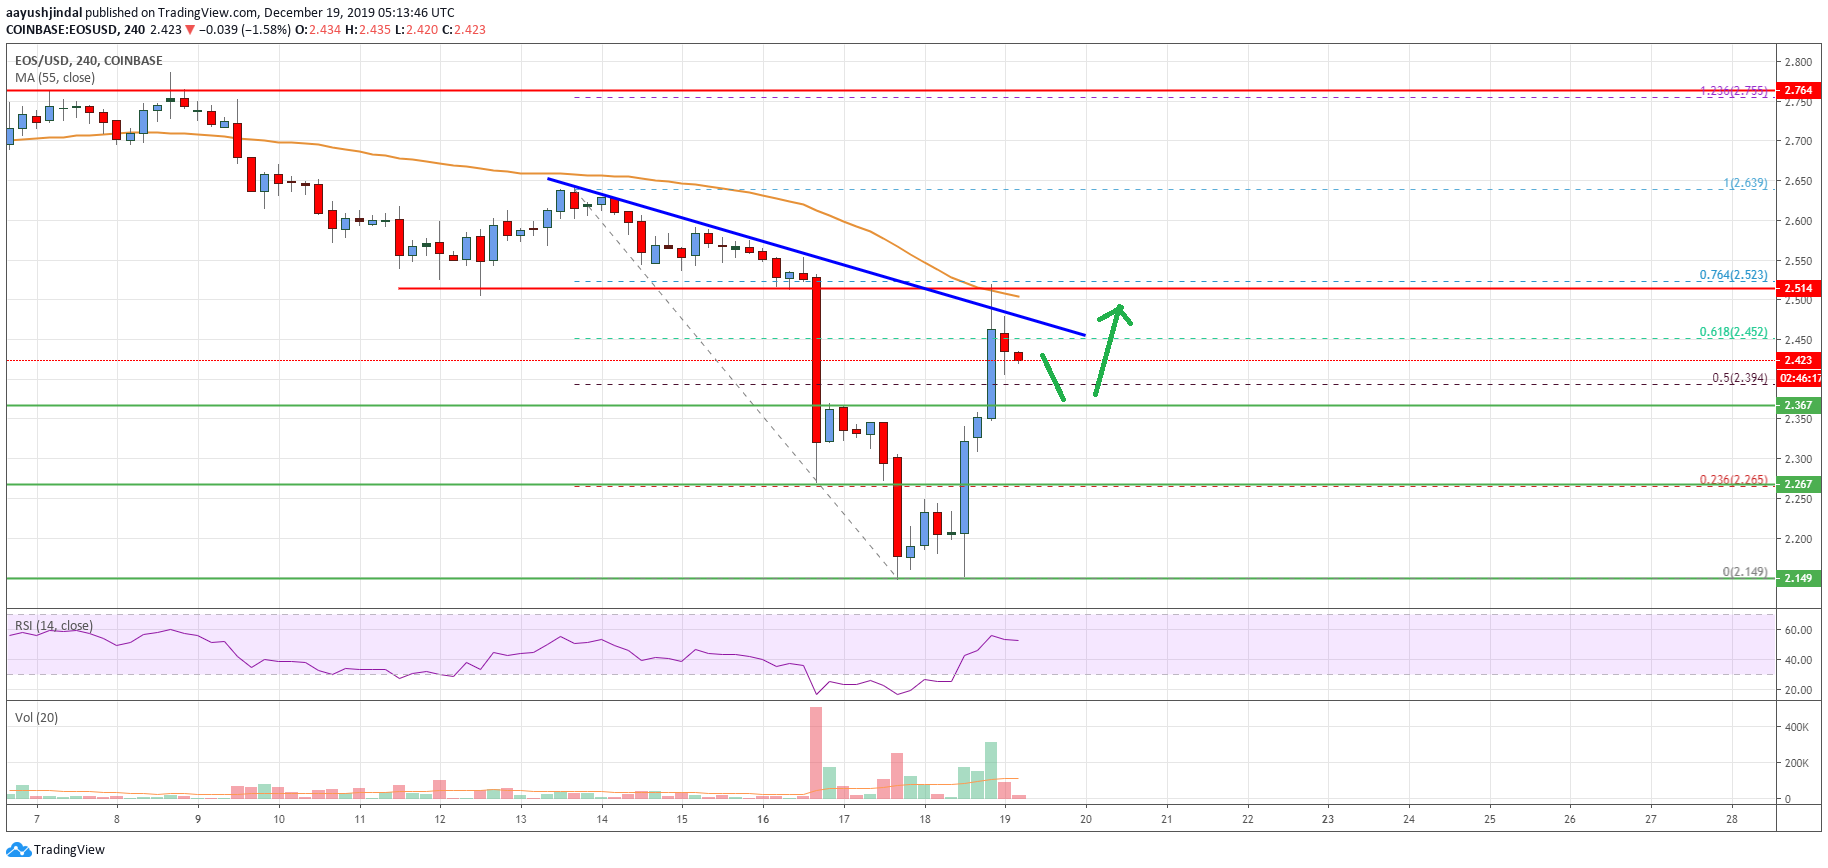
This week, there was a downside extension in bitcoin, Ethereum, ripple, litecoin and EOS against the US Dollar before the bulls took a stand. EOS price traded to a new monthly low near $2.149 and recently started a nice recovery wave.
There was a sharp move above the $2.200 and $2.300 levels. Moreover, there was a break above the 50% Fib retracement level of the key decline from the $2.639 high to $2.149 low.
However, the price ran into a major resistance near the $2.500 level and the 55 simple moving average (4-hours). More importantly, there is a crucial bearish trend line forming with resistance near $2.480 on the 4-hours chart of the EOS/USD pair.
The price also failed near the 76.4% Fib retracement level of the key decline from the $2.639 high to $2.149 low. It is now trading near the $2.420 level, with an immediate support near the $2.360 level.
The main support is near the $2.250 level, below which the price is likely to accelerate lower towards the $2.150 level. On the upside, the price is facing a strong resistance near the $2.500 level and the 55 simple moving average (4-hours).
A clear break and close above the $2.500 level could start another rally. The next stop for the bulls might be near the $2.639 high. Any further gains could push the price towards the $2.750 level or the 1.236 Fib extension level of the key decline from the $2.639 high to $2.149 low.
Looking at the chart, EOS price is showing a lot of positive signs above $2.300 and $2.250. Having said that, a successful close above the $2.500 resistance and the 55 SMA is needed for the bulls to remain in action in the near term.
Technical indicators
Hourly MACD – The MACD for EOS/USD is slowly losing momentum in the bullish zone.
Hourly RSI (Relative Strength Index) – The RSI is currently nicely above the 50 level.
Major Support Levels – $2.360 and $2.250.
Major Resistance Levels – $2.500 and $2.640.