
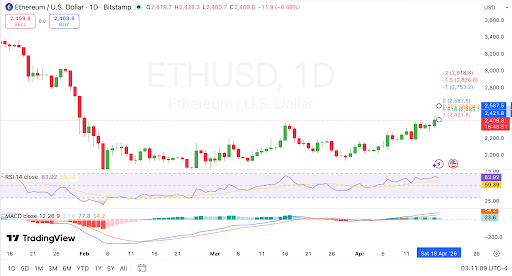
ETH breaks $2,385 resistance on the daily chart, with momentum indicators supporting a technical target near $2,900.
Ethereum cleared the key $2,385 resistance area on the daily chart, and the move has shifted market focus to higher levels.
The breakout follows several weeks of rising lows, and it places the next technical target near $2,900.
Traders are now watching whether ETH can hold above the breakout zone, because that level may now act as support.
ETH Breaks Above $2,385 Resistance
Ethereum moved above $2,385 after trading below that zone for several sessions.
The move marked a break from a tightening price pattern on the daily chart.
Market analysts had tracked that level closely, because it capped recent upside attempts.
The breakout also came after a steady recovery from the earlier decline. ETH had dropped from the $3,300 to $3,400 region and later found support near $1,900 to $2,000.
Since then, the chart has shown higher lows and higher highs, and that has improved the short-term structure.
Ethereum $ETH opens the path to $2,900!
Ethereum has officially cleared the X-axis of its ascending triangle, breaking through the critical $2,385 resistance level.
This breakout is a significant structural shift. By flipping $2,385 into a support floor, ETH has neutralized the… https://t.co/NLesHeyzQH pic.twitter.com/Pi0H5ypcts
— Ali Charts (@alicharts) April 17, 2026
Analysts often view a move above triangle resistance as a trend continuation signal.
In this case, the break above $2,385 has changed a former ceiling into a level that bulls want to defend.
As long as price stays above that area, the breakout remains active. The chart also shows a price near $2,411.6 at the time of the setup.
That places ETH above the former resistance band, but still below the next cluster of levels. Those overhead zones may shape the next stage of price action.
Momentum Indicators Support the Breakout
The daily RSI reading stood near 64.08, while its average was around 59.40.
That level points to firm bullish momentum, but it does not yet place ETH in a stretched condition.
Traders often read this range as support for further upside, especially during a breakout phase.
RSI also remained above the 60 mark, and that tends to support bullish control.
A drop back below that area could point to weaker momentum. For now, the indicator suggests buyers still have room to push prices higher.
The MACD also showed a bullish structure on the chart. The MACD line remained above the signal line, and the histogram stayed in positive territory.
That setup usually points to ongoing upside pressure rather than immediate weakness.
Momentum tools do not confirm targets on their own, but they help support the broader chart view.
In this case, both RSI and MACD align with the breakout above resistance. That is why the market is treating the move as more than a brief spike.
Read Also:
Path to $2,900 Depends on Support Holding
With $2,385 cleared, traders are now tracking higher resistance levels at $2,421.8, $2,485.1, $2,524.2, and $2,587.5.
A sustained move through those areas would strengthen the case for a push toward $2,900.
That level is the technical objective tied to the breakout formation. The path higher may not be direct, because resistance often causes pauses.
Even so, a daily close above each nearby level would keep the advance intact.
Price behavior around $2,421 to $2,425 may be especially important in the near term.
Support now sits in the $2,350 to $2,380 area, just below the breakout point.
Below that, the next support zones appear near $2,280 to $2,300 and then around $2,200. If ETH returns below those areas, the breakout case would weaken.
For now, the chart remains bullish while ETH holds above the former resistance band.
The move above $2,385 has opened the path to $2,900, and the next sessions may show whether buyers can keep control.
The setup remains active, but support retention will be the key test.


Leave a Reply
You must be logged in to post a comment.