
Here’s a clear look at Ethereum’s short-term challenges and long-term growth signals. Could a reclaim of the $4,000 zone be underway?
Ethereum has moved through a rough trading period as liquidity changes and ETF outflows continue to pressure its price.
Recent sessions now show heavy swings across support and resistance zones for Ethereum.
Many traders are watching these moves closely because they often show how the market reacts to fresh data and new liquidity trends.
Current Market Setup
Ethereum recently hovered around $2,739, before climbing slightly above $3,000 according to aggregated data from CoinMarketCap.
This level shows that the bulls are attempting to stamp out the price weakness across daily and monthly timeframes. The initial slide came after heavy outflows from spot Ethereum ETFs during November.
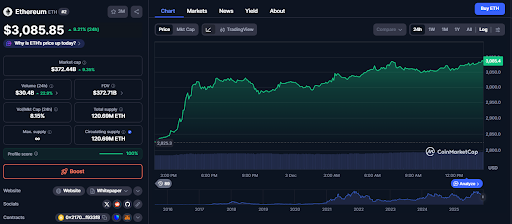
CoinShares recorded about $1.42 billion leaving Ethereum-related products over that period. These withdrawals affected the latest bout of selling pressure and might have led to Ethereum’s slide downwards in the first place.
Macro drivers are also weighing on the chart. Changes in interest rate expectations, moves in dollar liquidity and rapid rotations between equities and crypto assets are all pressing on ETH.
So far, technical watchers are studying multi-year patterns that have affected price movement since 2021.
The chart now shows long stretches of sideways activity, and a double top at major resistance levels indicates bearish exhaustion. This means that while traders are moving with caution, the bearish strength could be close to fading.
Short-Term Downside Zones
Some chart analysts believe Ethereum may revisit the $2,620 to $2,640 area if price fails to climb back above $2,800. This lower region has acted as a demand zone before. Buyers stepped in here during previous dips, which makes it an area of interest for short-term trades.
A bearish channel has also developed across lower timeframes.
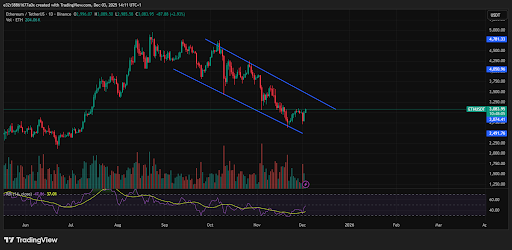
This downward-sloping structure indicates that sellers are still active. This being said, if the price stays inside this channel, analysts are warning of a slide toward $2,500.
Related Reading: Ethereum Sees $79M ETF Outflows While Institutions Keep Buying
Long-Term Strength Signals
Longer timeframes are now offering a different picture. If Ethereum rises above $2,800 and holds that level, chart models are now pointing to a possible path toward the $3,000 region.
Traders are focusing on this move because it shows demand returning to the market after weeks of consolidation.
Analysts have listed several levels that played important roles in previous cycles.
For example, ranges near $2,200, $1,500, and $1,100 marked major accumulation zones during past downturns. These areas lined up with periods of regulatory stress and aggressive risk-off rotations.

Many long-term investors now refer to them as historical anchors for buying activity rather than future guarantees.
In all, investors should be on the lookout for these price levels in Ethereum’s future.
On the upside, the $2,800, $2,500, $2,620, and $1,500 zones are some of the most important price levels to watch out for as Ethereum attempts a retake of the $4,000 zone.

