HomeEthereumEthereum Bulls Eye $2,500 And $3,100 SMA Breaks To Confirm Uptrend

Ethereum Bulls Eye $2,500 And $3,100 SMA Breaks To Confirm Uptrend

-

Ethereum trades near $2,073 as bulls watch $2,500 and $3,100 SMA levels for signs of a stronger trend reversal.

Ethereum bulls watch $2,500 and $3,100 SMA levels as key triggers for a possible uptrend.

ETH remains near support, while weak momentum keeps pressure on buyers. A reclaim of the 200-week SMA and a break above the 50-week SMA may shift market structure.

Ethereum Faces Pressure Below The 200-Week SMA

Ethereum remains below the 200-week simple moving average, which sits near $2,500.

This level is now the first major test for buyers. A clear reclaim would suggest that demand is returning.

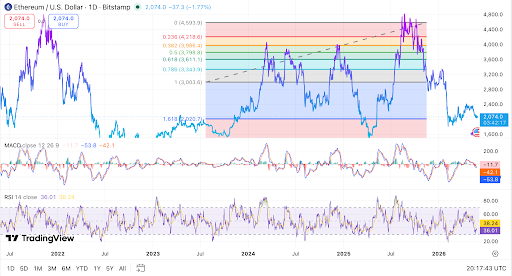
However, ETH was trading near $2,073 on the daily Bitstamp chart. The price is still under several former support zones.

Therefore, analysts are watching whether the current bounce can gain strength. The $2,000 to $2,020 area remains important for short-term support.

This zone lines up with the 1.618 Fibonacci extension on the chart. A daily close below it could place pressure on lower demand areas.

Meanwhile, the $2,500 level may act as resistance if ETH moves higher. Analysts may defend that zone after the latest decline.

So, buyers need a firm close above it to change the near-term view.

Bulls Need $3,100 Break To Confirm Trend Shift

The next key level sits near $3,100, where the 50-week SMA is located. This zone is above current prices and may act as resistance.

However, a clean break above it would strengthen the bullish case. Ethereum lost the $3,003 region during the recent decline.

That area had supported price during earlier trading ranges. As a result, a move above $3,100 would show a stronger recovery.

Market analysts may treat this level as a trend filter. Until ETH clears it, rallies may remain limited.

Buyers also need stronger volume to support any move above the weekly average.

The move above $3,100 would also place ETH back above a key price shelf.

That may help reduce pressure from recent lower highs. Still, price needs follow-through after any breakout attempt.

Read Also:

ETH Price Debate Shifts as Corporate Whales Overtake Ethereum Foundation

Momentum Remains Weak As Support Holds

The daily MACD remains below the zero line, which shows weak momentum. The MACD line is also below the signal line.

This setup suggests sellers still have control in the short term. The RSI is near 36, which places it below the neutral 50 level.

That reading shows weak buying strength, but it is not deeply oversold. Therefore, the market may still move unevenly before a firm recovery.

Ethereum chart shows bulls watching $2,500 and $3,100 SMA levels
Ethereum chart shows bulls watching $2,500 and $3,100 SMA levels. Source: TradingView

Ethereum also formed lower highs and lower lows after its latest peak. The move down from the $4,600 to $4,800 zone changed the broader structure.

Price then failed to hold several Fibonacci retracement levels. For now, ETH bulls need two clear signals to confirm an uptrend.

The first is a reclaim of the 200-week SMA near $2,500. The second is a clean break above the 50-week SMA near $3,100.

FOLLOW US

Most Popular

Banner