
Ethereum’s drawdown deepens, but compressed leverage and negative funding raise odds of volatility before true capitulation.
Ethereum is nearing a rare technical threshold, with price action pointing toward a sixth consecutive monthly red candle. According to market commentators, such an outcome would place the current drawdown just one month away from matching the 2018 seven-month losing streak, the longest in its history.
Open Interest Collapse Signals Major Leverage Flush in ETH
As per Coinglass data, January closed down 17.52%, followed by a 19.81% decline in February. March has attempted stabilization but remains vulnerable. Should it close negative, Ethereum would enter statistically uncommon territory. Seasonality adds further weight. March has historically averaged a 17.24% gain, with a 9.33% median return. A red close would mark a clear break from that pattern.
📉 $ETH Monthly Close Watch
Ethereum is on track to print its 6th consecutive monthly red candle.
The longest streak ever recorded was 7 straight red months back in 2018.#ETH #Ethereum #CryptoMarket pic.twitter.com/q88SyBImv8
— Dariusz Kowalczyk (@darekinvest) March 1, 2026
Looking back at 2018 provides perspective, as that stretch followed the post-ICO bubble collapse. Monthly losses frequently ranged between 20% and 50%. Volatility was elevated and derivatives markets were far smaller.
By contrast, the current drawdown has been persistent but less violent. Price has trended lower in a controlled manner rather than through sharp capitulation waves.
Open interest across exchanges peaked near $30 billion during the 2025 rally. It now stands around $11.6 billion, reflecting a contraction of roughly 60% to 65%. Such a decline confirms a broad deleveraging cycle rather than a mild correction.
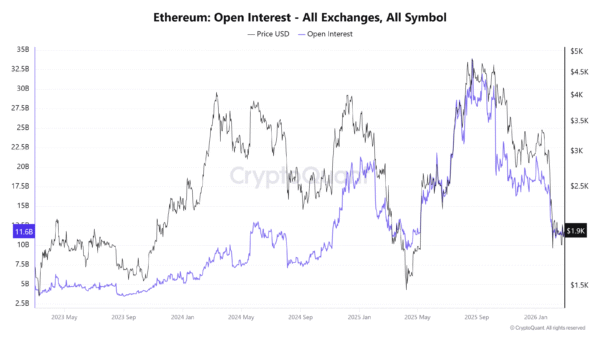
Image Source: CryptoQuant
More importantly, open interest is no longer falling aggressively. Most long-side crowding has already cleared. Positioning appears compressed rather than stretched. Early bear markets often show rising leverage before deeper breakdowns. Current conditions resemble a late-stage reset instead of fresh excess.
Funding rates reinforce that shift. Positive readings seen during January’s crowded positioning have turned negative. Current levels hover near -0.0043. Shorts are paying longs, signaling a downside bias in sentiment.
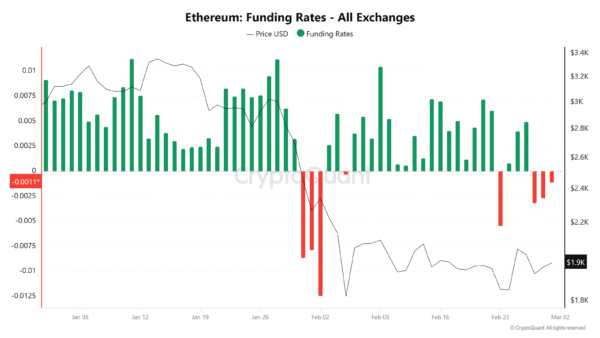
Image Source: CryptoQuant
Sustained negative funding during compressed open interest periods often creates asymmetry. Short squeezes or relief rallies can emerge even within broader downtrends. In 2018, by comparison, weak funding reflected structural demand collapse rather than positioning imbalance.
ETF Outflows and Short Positioning Cloud Ethereum’s Monthly Close
Institutional flows add another dimension, as spot Ethereum ETFs have recorded approximately $369.8 million in monthly net outflows. Inflows during mid-last year supported the rally toward the $4,000 to $5,000 range. Current weakness, however, is unfolding alongside reduced institutional exposure.
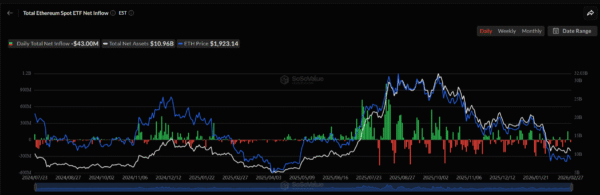
Image Source: SoSoValue
Although outflows point to softer risk appetite, total assets under management remain substantial. Activity suggests tactical de-risking rather than structural exit. Institutions appear cautious but not fully withdrawn.
Exchange netflows show a steady rise in inflows during price weakness. Coins are moving onto trading platforms, signaling distribution pressure. However, flows have not reached panic levels associated with major capitulation events. No single monthly flush of 30% to 40% has occurred.
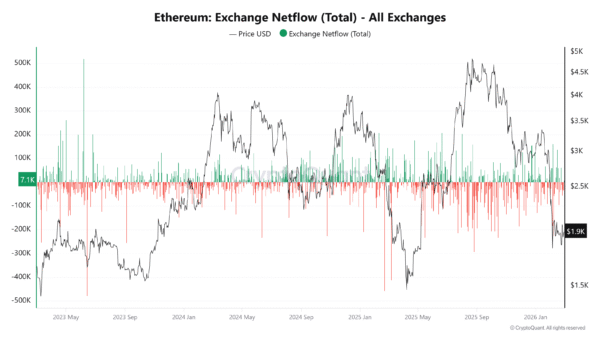
Image Source: CryptoQuant
Essentially, selling appears controlled rather than disorderly. Gradual distribution prevails over forced liquidation. That distinction separates current conditions from the rapid collapse seen in 2018.
Looking ahead, a continued grinding lower would require sustained ETF outflows and renewed short build-up alongside rising open interest. A short squeeze becomes plausible if funding stays negative while positioning remains compressed. Such an imbalance could trigger higher volatility.
A true capitulation scenario would require sharp exchange inflow spikes, a rapid surge in open interest followed by a collapse, and a large monthly drawdown. So far, evidence for that outcome remains limited.
Six consecutive red months would be statistically rare. Besides, structural signals do not mirror the violence of 2018. Ethereum now sits between exhaustion and renewed pressure. The coming monthly close may shape the next decisive move.

