- Ethereum price started a fresh decline from the $3,400 resistance against the US Dollar.
- ETH price is now trading below $3,300 and the 55 simple moving average (4-hours).
- There was a break below a key contracting triangle with support near $3,300 on the 4-hours chart (data feed from Coinbase).
- The pair could continue to move down below the $3,200 support zone.
Ethereum price is struggling below $3,300 against the US Dollar. ETH/USD remains at a risk of a sharp decline if there is a clear break below $3,100.
Ethereum Price Analysis
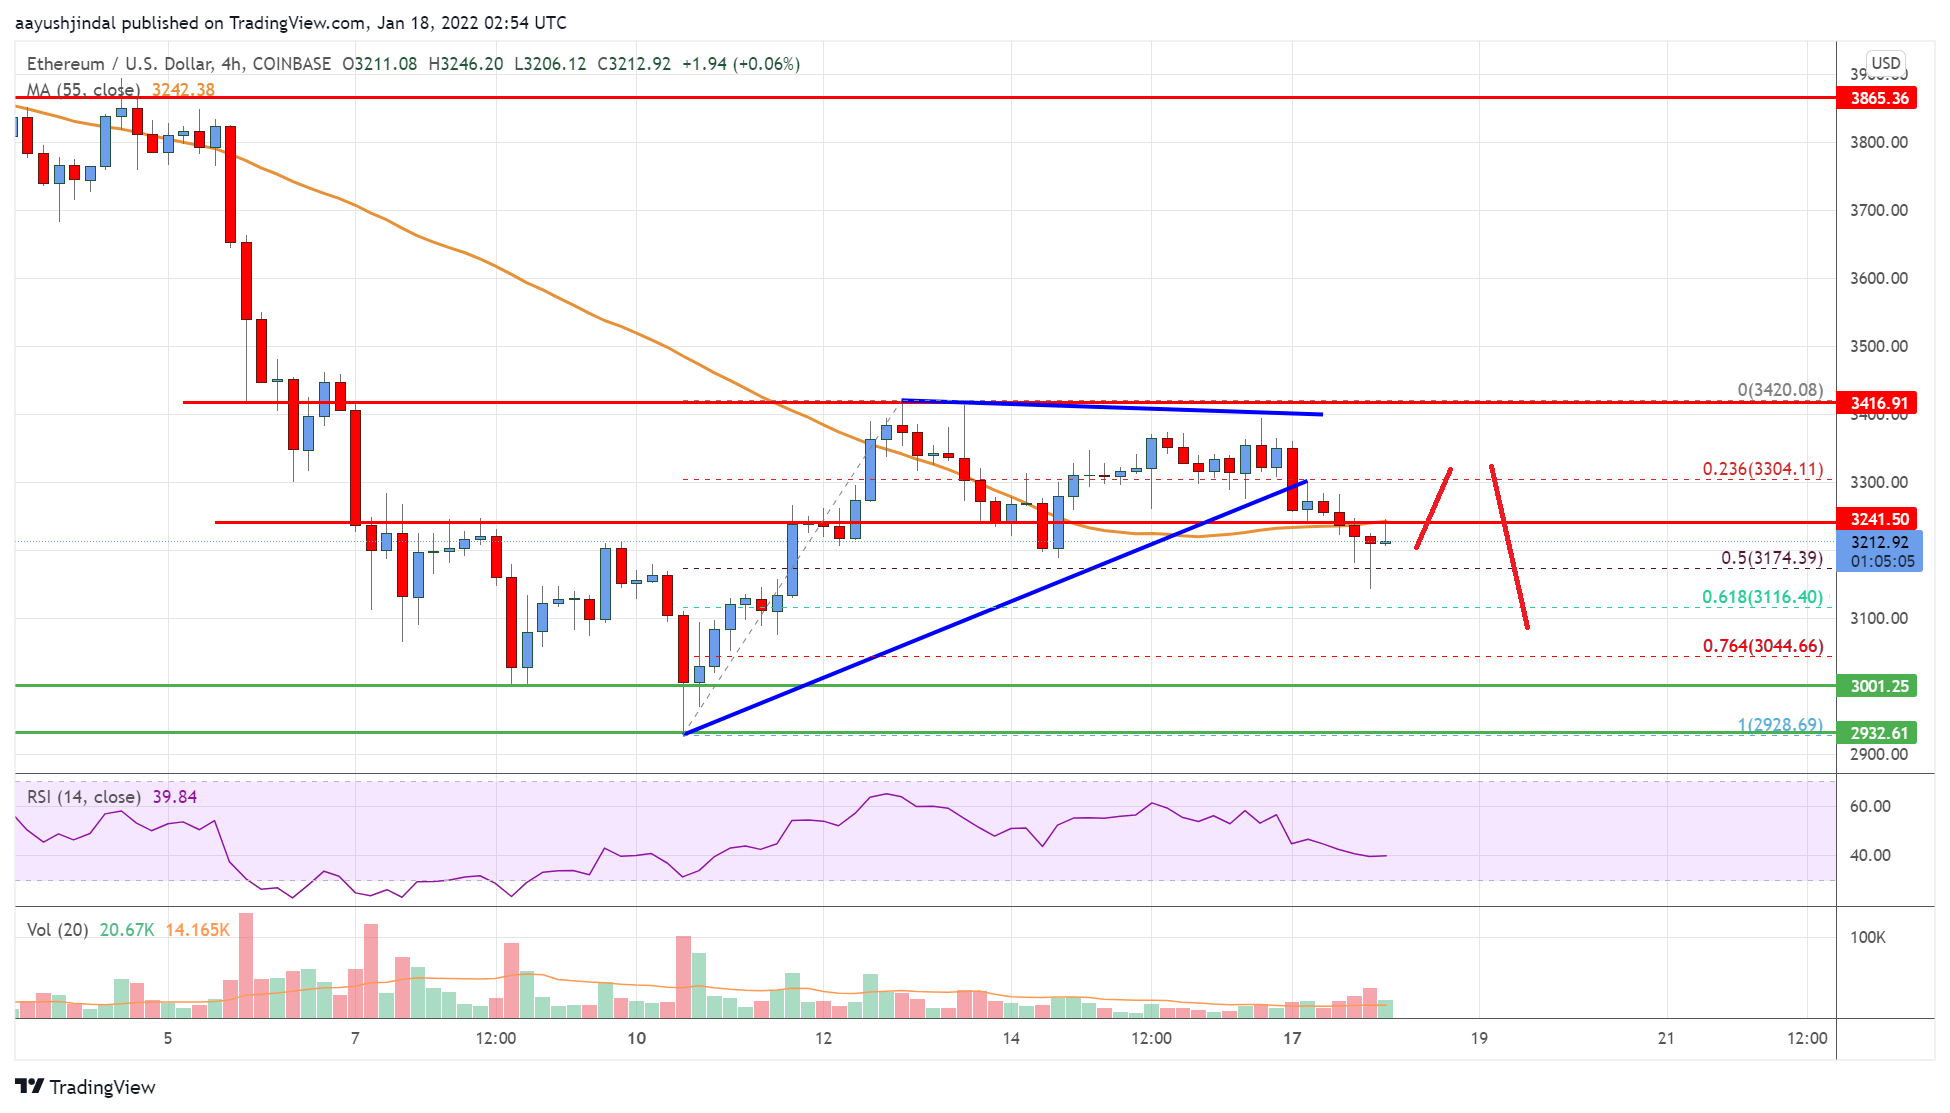
Recently, ethereum saw a fresh decline from the $3,400 zone against the US Dollar. ETH price formed a high near the $3,420 level and started a fresh decline.
There was a move below the $3,320 and $3,300 support levels. Besides, there was a break below a key contracting triangle with support near $3,300 on the 4-hours chart. The pair tested the 50% Fib retracement level of the upward move from the $2,928 swing low to $3,420 high.
It is now trading below $3,300 and the 55 simple moving average (4-hours). On the upside, the price is facing resistance near the $3,250 level.
The main resistance is now forming near the $3,400 level. A close above the $3,400 level could start a major increase. The next major stop for the bulls could be near the $3,600 level, above which it could rise towards the $3,800 level. An immediate support on the downside is near the $3,200 level.
The next major support is now near the $3,100 level. It is near the 61.8% Fib retracement level of the upward move from the $2,928 swing low to $3,420 high.
A break below the $3.100 support could push the price to $3,000. Any more losses could lead the price towards $2,850. The next major support is near the $2,650, where the bulls might take a stand.

Looking at the chart, Ethereum price is clearly trading below the $3,300 zone and the 55 simple moving average (4-hours). Overall, ether price could start a steady upward move if there is a move above the $3,400 level.
Technical indicators
4 hours MACD – The MACD for ETH/USD is slowly gaining momentum in the bearish zone.
4 hours RSI (Relative Strength Index) – The RSI for ETH/USD is now below the 50 level.
Key Support Levels – $3,200, followed by the $3,100 zone.
Key Resistance$ Levels – $3,250 and $3,400.


Leave a Reply
You must be logged in to post a comment.