
- Ethereum price is holding gains above the $3,500 support against the US Dollar.
- ETH price is now trading above $3,800 and the 55 simple moving average (4-hours).
- There is a major breakout pattern forming with resistance near $3,965 on the 4-hours chart (data feed from Coinbase).
- The pair could continue to rise as long as it is above $3,600 and $3,500.
Ethereum price is showing bullish signs below $3,800 against the US Dollar. ETH/USD could accelerate further higher if it clears the $3,950 and $4,000 resistance levels.
Ethereum Price Analysis
In the past few days, ethereum saw a decent increase above $3,500 against the US Dollar. ETH price even broke the $3,650 resistance and settled above the 55 simple moving average (4-hours).
The bulls pumped the price above the $3,800 and $3,850 levels. Finally, the price spiked above $4,000 and traded as high as $4,030. It is now consolidating gains below the $4,000 resistance zone. It traded below the $3,950 and $3,920 levels.
Ether traded close to the 23.6% Fib retracement level of the upward move from the $3,145 swing low to $4,030 high. There is also a major breakout pattern forming with resistance near $3,965 on the 4-hours chart.
On the upside, an initial resistance is near the $3,965 zone. The first major resistance is near the $4,000 level, above which the price is likely to resume its increase in the near term. The next stop for the bulls could be near the $4,500 level. An intermediate resistance might be near the $4,200 level.
An immediate support is near the $3,900 level and the triangle lower trend line. If there is a downside break below the trend line support, the price could test $3,700. Any more losses could lead the price towards $3,600. It is near the 50% Fib retracement level of the upward move from the $3,145 swing low to $4,030 high.
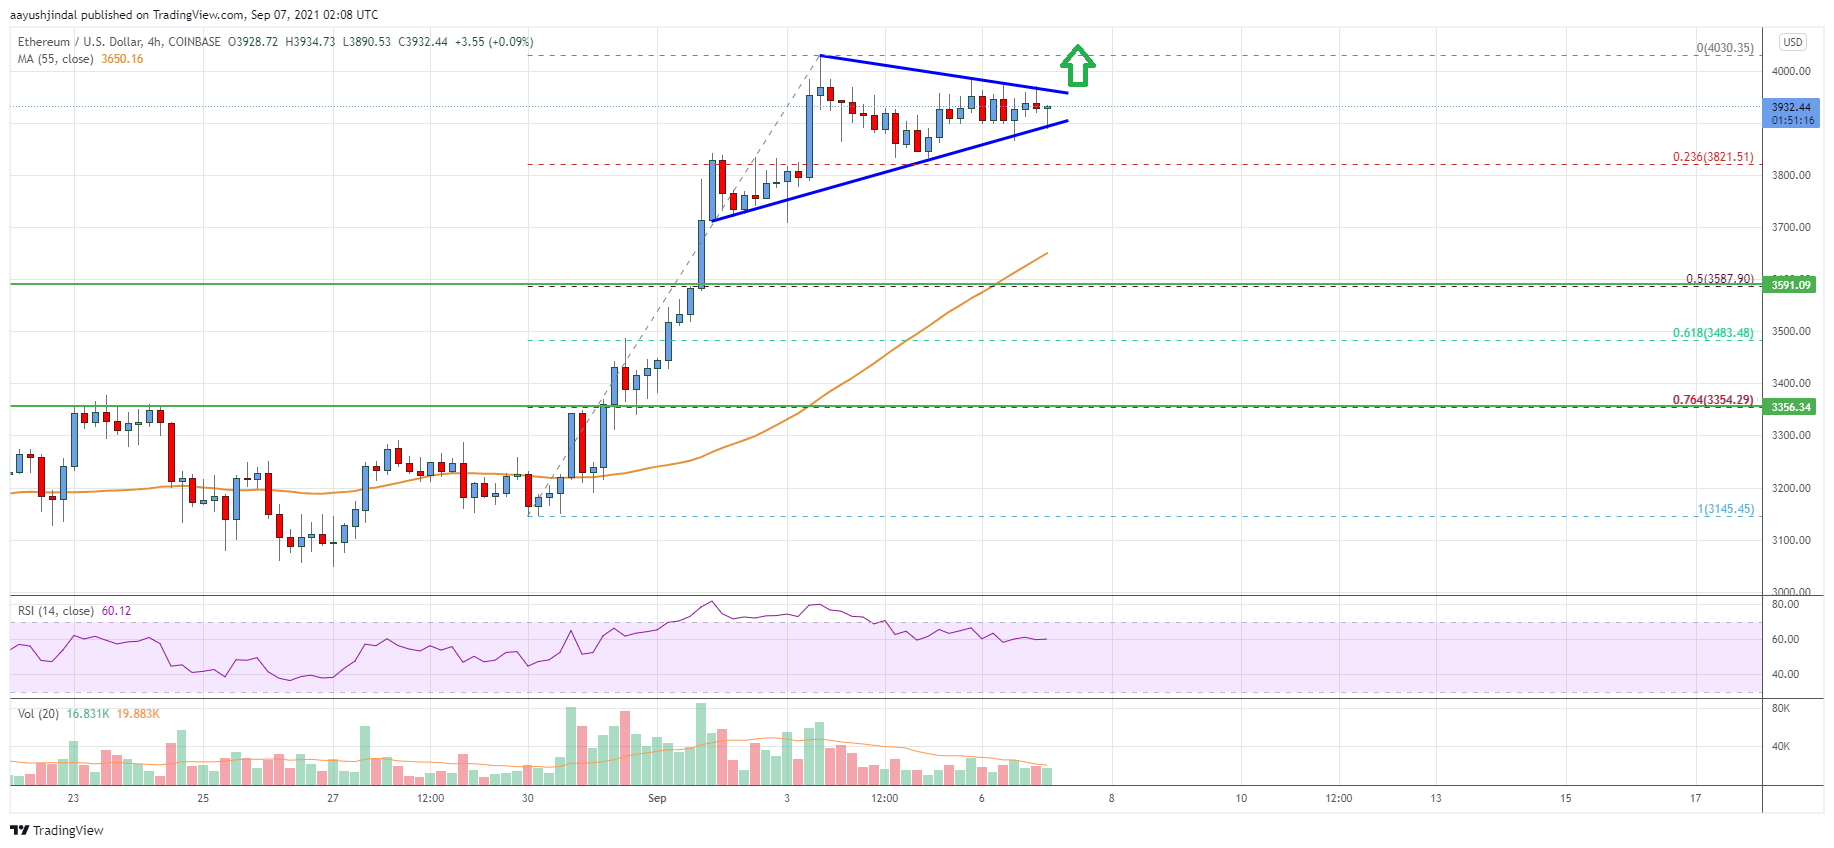
Looking at the chart, Ethereum price is clearly trading well above the $3,600 zone and the 55 simple moving average (4-hours). Overall, ether price could continue to rise as long as it is above $3,600 and $3,500.
Technical indicators
4 hours MACD – The MACD for ETH/USD is slowly gaining momentum in the bullish zone.
4 hours RSI (Relative Strength Index) – The RSI for ETH/USD is still above the 50 level.
Key Support Levels – $3,900, followed by the $3,700 zone.
Key Resistance Levels – $3,965 and $4,000.


Leave a Reply
You must be logged in to post a comment.