- Ethereum price is facing a significant resistance near $152 and $158 against the US Dollar.
- ETH price is currently trading just above the $145 and $143 support levels.
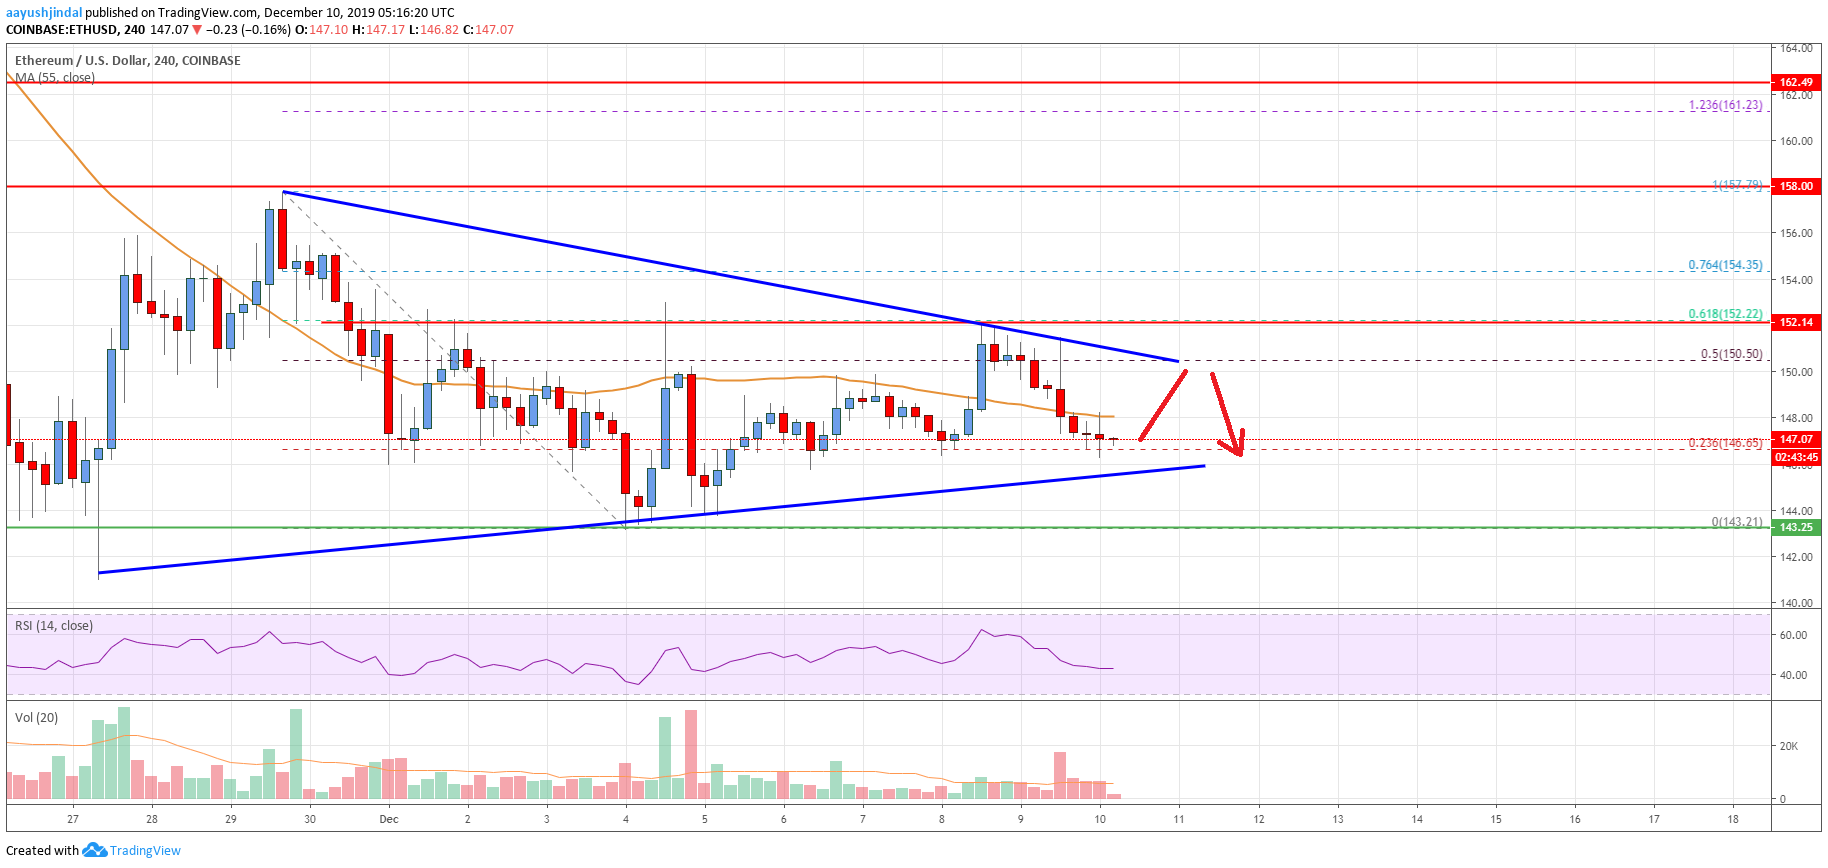
- There is a major contracting triangle forming with resistance near $151 on the 4-hours chart (data feed from Coinbase).
- The price could start a strong upward move once it breaks $151 and $152.
Ethereum price is trading in a contracting range against the US Dollar. ETH/USD needs to gain strength above $152 to start a solid upward move in the coming days.
Ethereum Price Analysis
After a fresh decline, Ethereum price found support near the $143 level against the US Dollar. ETH traded as low as $143.21 and later corrected above the $150 level and the 55 simple moving average (4-hours).
Besides, there was a break above the 50% Fib retracement level of the downward move from the $158 swing high to $143 swing low. However, the price struggled to clear the $152 resistance area.
The bulls made two attempts to clear the $152 resistance area, but it failed to gain strength. Moreover, the price failed to settle above the 61.8% Fib retracement level of the downward move from the $158 swing high to $143 swing low.
At the outset, there is a major contracting triangle forming with resistance near $151 on the 4-hours chart. On the upside, Ethereum price seems to be facing a lot of hurdles near the $150, $151 and $152 levels.
If there is a clear break above the $152 resistance, the price could continue to rise towards the $158 level. The next major resistance is near the $162 zone.
An intermediate resistance is near the 76.4% Fib retracement level of the downward move from the $158 swing high to $143 swing low. On the downside, there are key supports near $145, $143 and $142.
Therefore, a daily close below the $142 support area might put a lot of pressure on the bulls. In the mentioned case, the price is likely to accelerate lower below $140 and $136. The next major support area is near the $132 level.

Looking at the chart, Ethereum price is clearly facing a strong resistance near the $151 and $152 levels. In the short term, there could be ranging moves, but the price is likely to make the next big move either towards $165 or $132.
Technical indicators
4 hours MACD – The MACD for ETH/USD is currently in the bearish zone.
4 hours RSI (Relative Strength Index) – The RSI for ETH/USD is now below the 50 level, with a bearish angle.
Key Support Levels – $143, followed by the $138 zone.
Key Resistance Levels – $152 and $158.


Leave a Reply
You must be logged in to post a comment.