- Ethereum price extended its decline below $235 and tested $230 against the US Dollar.
- ETH price is currently recovering and trading well above the $232 support zone.
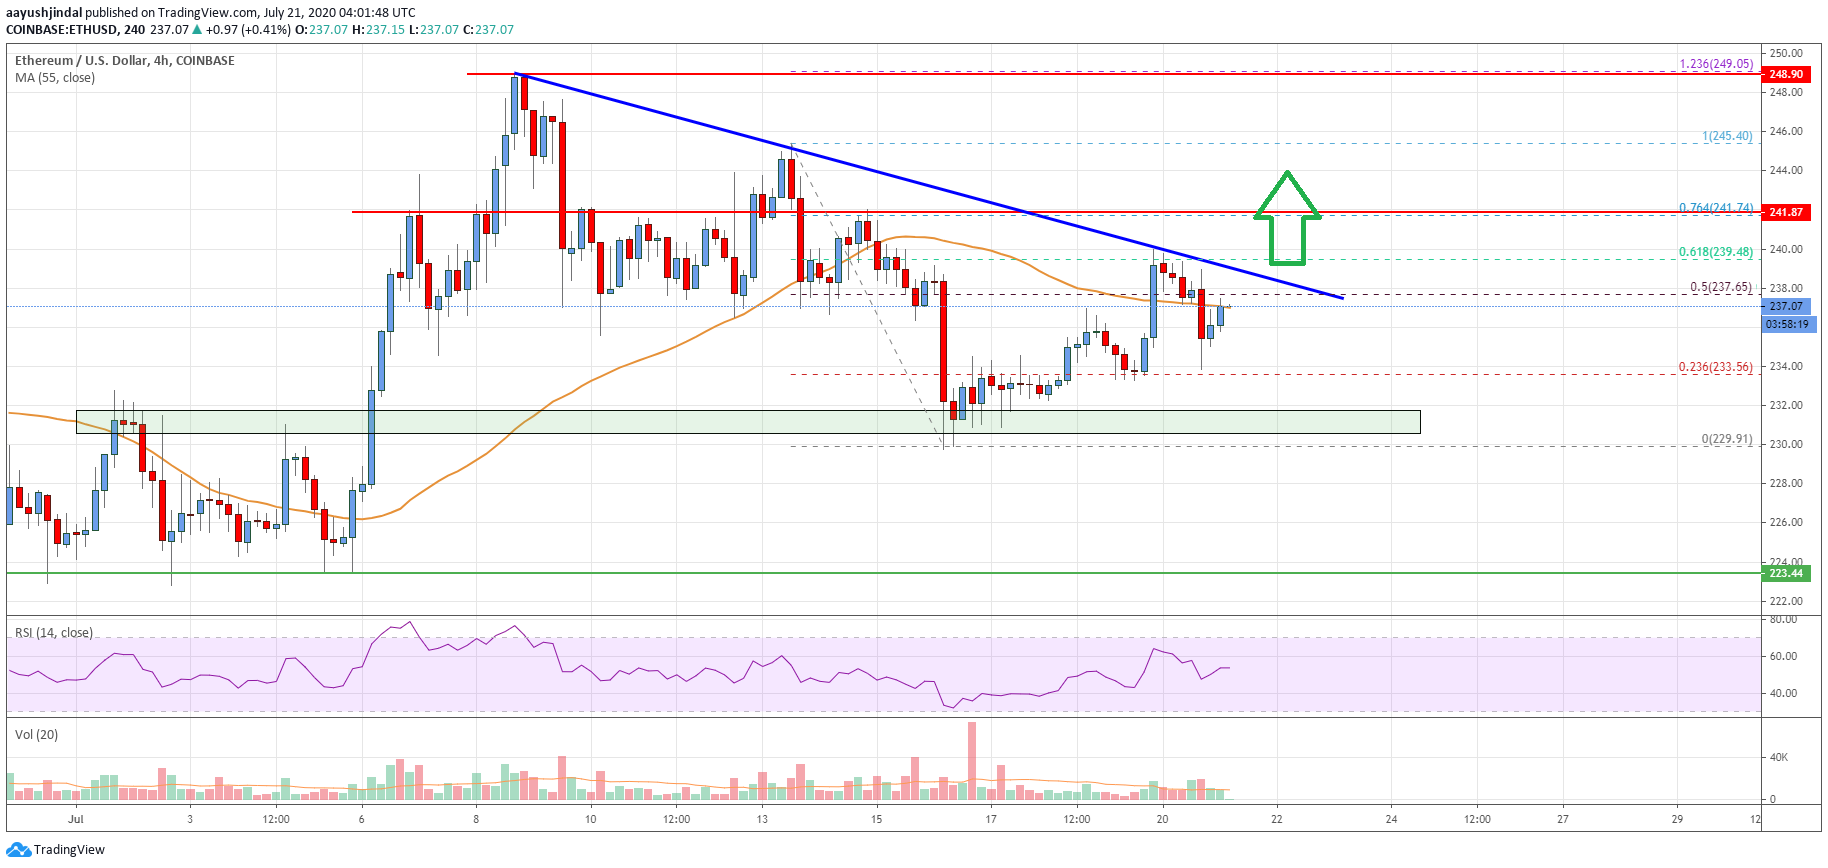
- There is a major bearish trend line forming with resistance near $238 on the 4-hours chart (data feed from Coinbase).
- The pair could start a strong increase if it clears the $238 and $240 resistance levels.
Ethereum price is holding the $232 and $230 support levels against the US Dollar. ETH/USD must surpass the $240 barrier to initiate a fresh rally in the near term.
Ethereum Price Analysis
After a close below the $240 support, Ethereum price extended its decline against the US Dollar. ETH price broke the $235 support and the 55 simple moving average (4-hours).
It tested the $230 support level and a swing low is formed near $229. The price is currently correcting higher and trading above the $232 level. Ether also broke the $235 level, and the 50% Fib retracement level of the downward move from the $245 high to $229 swing low.
However, the price seems to be facing a strong resistance near the $238 and $240 levels. There is also a major bearish trend line forming with resistance near $238 on the 4-hours chart.
The trend line is close to the 61.8% Fib retracement level of the downward move from the $245 high to $229 swing low. A successful break above the trend line might increase the chances of a fresh bullish wave above the $240 resistance in the near term.
The next major resistance is near the $248 and $250 levels, above which the bulls are likely to aim a test of the $265 level. Conversely, the price might struggle to clear $238 or $240.
In the mentioned bearish case, the price might decline below the $232 and $230 support levels. The next major support is seen near the $222 level, where the bulls might take a stand.
Looking at the chart, Ethereum price is clearly facing a couple of strong hurdles near the $238 and $240 levels. Therefore, the pair could start a strong increase if it clears the $238 and $240 resistance levels.
Technical indicators
4 hours MACD – The MACD for ETH/USD is slowly losing momentum in the bullish zone.
4 hours RSI (Relative Strength Index) – The RSI for ETH/USD is just above the 50 level, with a minor bearish angle.
Key Support Levels – $232, followed by the $230 zone.
Key Resistance Levels – $238 and $240.