- Ethereum price traded to a new all-time high at $2,043 before correcting lower against the US Dollar.
- ETH price is currently trading well below $1,750 and the 55 simple moving average (4-hours).
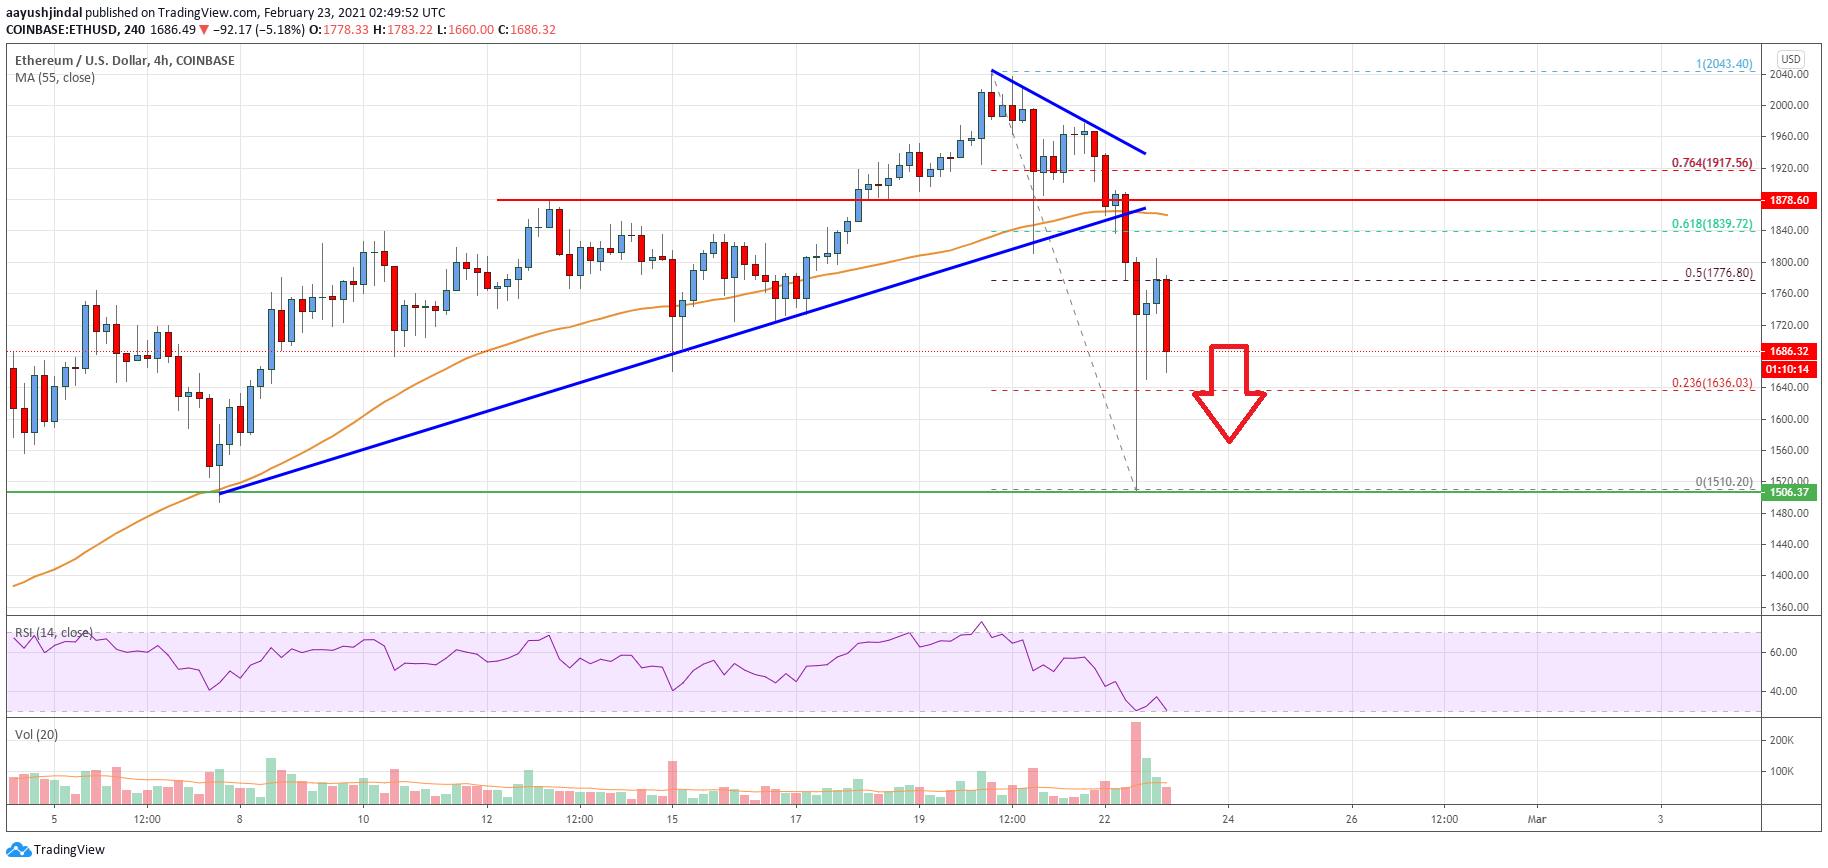
- There was a break below a major bullish trend line with support near $1,840 on the 4-hours chart (data feed from Coinbase).
- The pair is likely to continue lower towards the $1,640 and $1,600 levels in the near term.
Ethereum price is correcting gains from well above $2,000 against the US Dollar. ETH/USD is likely to revisit $1,600 before it could climb again.
Ethereum Price Analysis
After a close above $1,850, Ethereum extended its rise against the US Dollar. ETH even broke the $1,950 and $2,000 resistance levels. It traded to a new all-time high at $2,043 and settled above the 55 simple moving average (4-hours).
However, the price failed to extend gains above $2,050 and recently corrected lower. There was a sharp decline below the $1,850 support level. There was also a break below a major bullish trend line with support near $1,840 on the 4-hours chart.
The price dived below the $1,750 support and the 55 simple moving average (4-hours). It even spiked below $1,600 and traded as low as $1,510. Recently, there was an upside correction above $1,600 and $1,650.
The price climbed above the 23.6% Fib retracement level of the downward move from the $2,043 high to $1,510 low. However, the price failed to continue higher above the $1,800 level.
It seems like the bulls failed near the 50% Fib retracement level of the downward move from the $2,043 high to $1,510 low. The price is moving lower and trading well below $1,750. It seems like the price might continue to move down towards $1,600. The next major support sits near the $1,500 level.
Conversely, the price might start a fresh increase above the $1,750 and $1,800 resistance levels. The main resistance is now forming near $1,850 and the 55 simple moving average (4-hours).
Looking at the chart, Ethereum price is clearly trading in a bearish zone below $1,850 and the 55 simple moving average (4-hours). Overall, ether price likely to continue lower towards the $1,640 and $1,600 levels in the near term.
Technical indicators
4 hours MACD – The MACD for ETH/USD is gaining momentum in the bearish zone.
4 hours RSI (Relative Strength Index) – The RSI for ETH/USD is now well below the 50 level.
Key Support Levels – $1,600, followed by the $1,500 zone.
Key Resistance Levels – $1,750 and $1,850.
