- Ethereum price is struggling below the $1,620 resistance against the US Dollar.
- ETH price is now trading below $1,600 and the 55 simple moving average (4 hours).
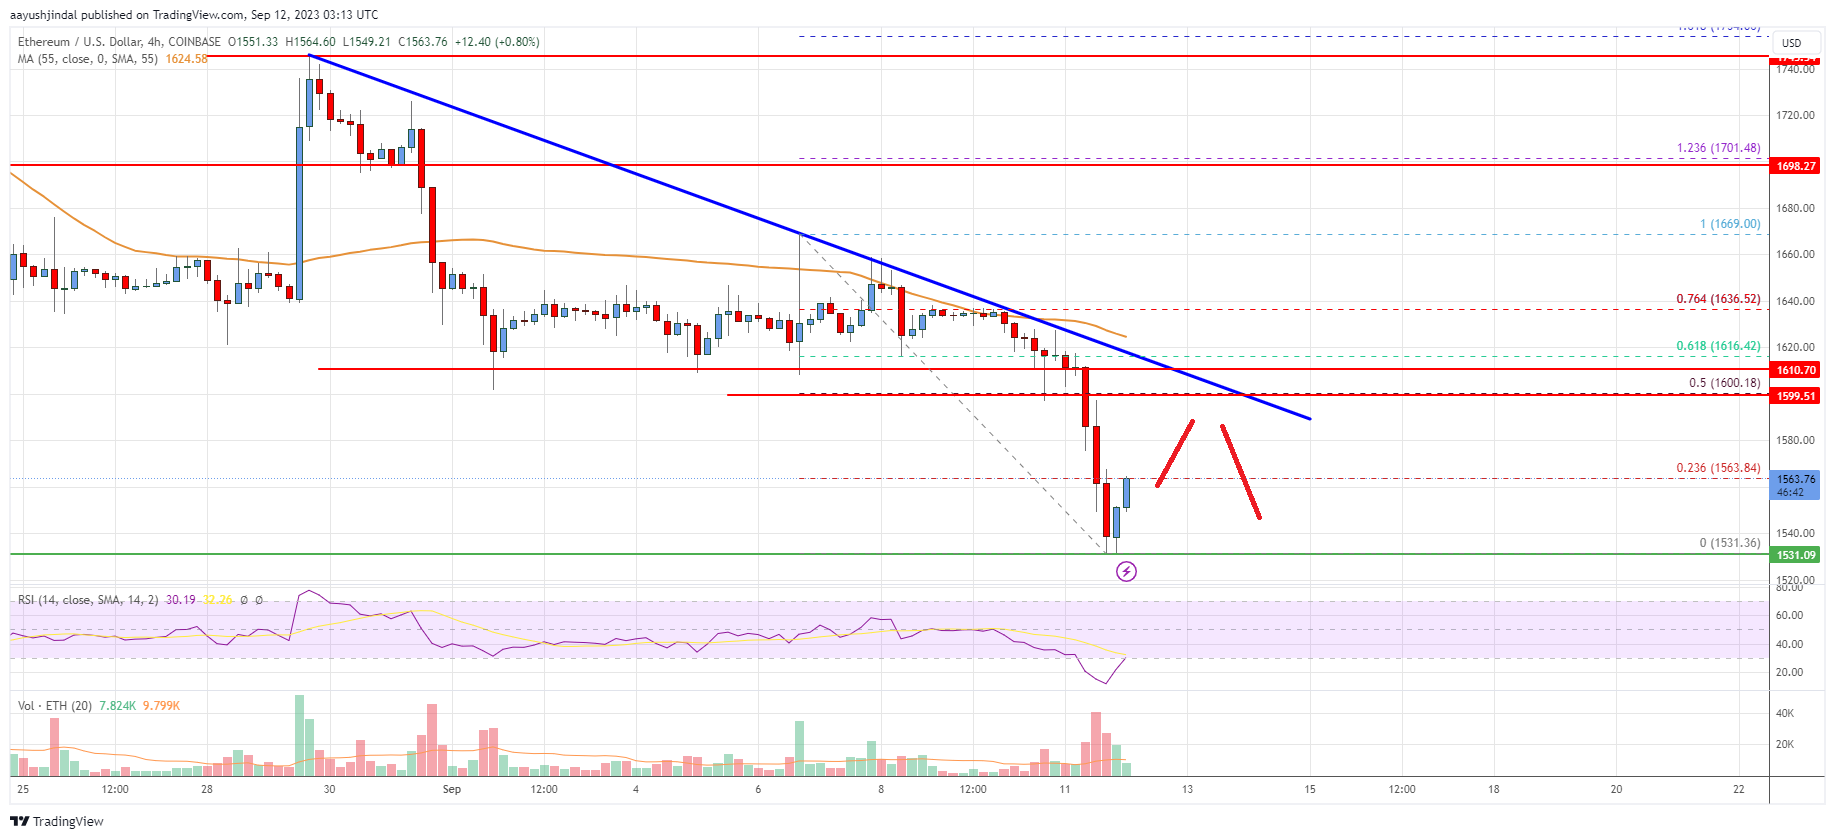
- There is a key bearish trend line forming with resistance near $1,600 on the 4-hour chart (data feed from Coinbase).
- The pair could continue to move down if it stays below $1,600 and $1,620.
Ethereum price is declining below $1,600 against the US Dollar. ETH/USD remains at a risk of more downsides if it fails to recover above $1,600.
Ethereum Price Analysis
This past week, Ethereum made a couple of attempts to gain strength above $1,650 against the US Dollar. ETH price failed to start a recovery wave above $1,650 and started a fresh decline.
It traded below $1,620 and $1,600 support levels to enter a bearish zone. There was also a break below the $1,550 level. A low is formed near $1,531 and the price is now consolidating losses. ETH is now trading below $1,600 and the 55 simple moving average (4 hours).
There is also a key bearish trend line forming with resistance near $1,600 on the 4-hour chart. It is slowly moving higher above the 23.6% Fib retracement level of the downward move from the $1,669 swing high to the $1,535 low.
On the upside, the price is now facing resistance near the $1,580 level. The next major resistance is near the $1,600 level and the trend line.
It is close to the 50% Fib retracement level of the downward move from the $1,669 swing high to the $1,535 low, above which the price could test the 55 simple moving average (4 hours) at $1,620. A clear move above the $1,620 resistance could send the price toward $1,700.
On the downside, initial support is near the $1,540 level. The next major support is now near the $1,535 level. A break below the $1,535 support could push the price to $1,480. If the bulls fail to protect the $1,480 support, the price might decline toward $1,420.
Looking at the chart, Ethereum price is trading below $1,600 and the 55 simple moving average (4 hours). Overall, Ether’s price could continue to move down if it stays below $1,600 and $1,620.
Technical indicators
4 hours MACD – The MACD for ETH/USD is now losing momentum in the bearish zone.
4 hours RSI (Relative Strength Index) – The RSI for ETH/USD is now below the 50 level.
Key Support Levels – $1,535, followed by the $1,480 zone.
Key Resistance$ Levels – $1,600 and $1,620.