
- XRP stays in a daily downtrend as price trades below $1.45 and sellers control market structure.
- Analysts say a $1.52 retest may occur before another decline toward the $1.27 support zone.
- MACD shows weak recovery signs, but momentum remains negative and favors bearish continuation.
XRP is drawing interest from traders this week. Popular crypto analyst Crypto Tony took to X to share a bearish outlook on the asset.
He pointed to $1.52 as a key level to watch. According to him, a retest of that zone would be “perfect” before price heads lower. The broader chart structure appears to support his concern.
XRP Bears Stay in Control
XRP has been sliding since January, when the price was near $2.40. Since then, the asset has printed a series of lower highs and lower lows.
That pattern confirms a bearish market structure on the daily chart. At the time of writing, XRP trades around $1.39, well below its 20-day moving average.
The Bollinger Band midline sits near $1.45 and has acted as dynamic resistance. Price has struggled to close above that level with any conviction. Until bulls reclaim that zone, sellers remain in the driver’s seat.
Analyst Flags $1.52 as a Critical Retest Zone
Crypto Tony shared a candlestick chart showing XRP’s February price action. The chart captured a rally from $1.40 up to $1.70, followed by a sharp pullback.
A retest of $1.52 really would be perfect before coming back down again pic.twitter.com/DaUboMouke
— Crypto Tony (@CryptoTony__) February 20, 2026
He noted that a retest of $1.52 would give the market a chance to sweep liquidity before more downside follows.
The analyst did not suggest a bullish reversal. His view pointed to $1.52 as a short-term magnet, not a recovery target. Replies to his post reflected mixed sentiment, though many traders agreed with the retest logic he laid out.
What the Indicators Are Saying
The MACD on the daily chart tells an interesting story. The MACD line sits at -0.095, still below the zero line. That confirms the bearish momentum has not reversed. However, the histogram has flipped slightly green, hinting at a weak corrective bounce.
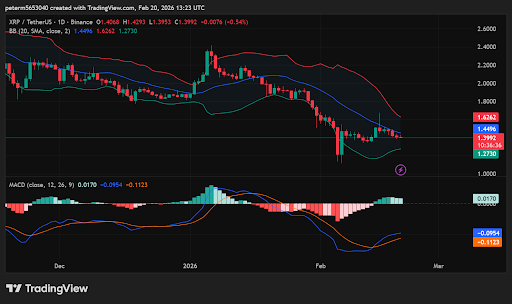
Bollinger Bands have started to contract. That suggests volatility is cooling after a sharp drop.
The lower band near $1.27 offered some support recently, but follow-through buying has been weak. Small-bodied candles in recent sessions point to indecision in the market, not strength.
Key Levels Traders Are Watching
Support at $1.27 to $1.30 is the most important zone right now. That area aligns with the lower Bollinger Band and a recent swing low. A break below that level could push XRP toward $1.10 or even $1.00.
On the upside, $1.45 is the first wall bulls need to clear. Above that, $1.62 to $1.65 marks the upper Bollinger Band and a strong resistance cluster.
A true trend shift would only come with a reclaim of the $1.80 level. Until then, any bounce is likely a counter-trend move, not a reversal. Traders appear to be watching closely before making any major moves.
