
Bitcoin trades under $76K cost basis, but on-chain data shows no major selling pressure.
Bitcoin has fallen below the average purchase price of one of its largest corporate holders. After more than five years of steady accumulation, Michael Saylor’s aggregate position now sits underwater. Market reaction has focused on the size of the unrealized loss. Broader data, however, suggests current conditions remain within Bitcoin’s normal volatility range.
Saylor’s Bitcoin Position Underwater as Derivatives Risk Builds
According to reports from Arkham, Michael Saylor’s Strategy has bought about $54.52 billion worth of Bitcoin since mid-2020. The average purchase price for this investment is around $76,027 per coin.
BITCOIN IS MORE THAN 10% BELOW SAYLOR’S AVERAGE PRICE
After 5 and a half years of buying Bitcoin – Saylor has purchased a total of $54.52B BTC at an average price of $76,027.
The price is currently 12.4% lower than his average – meaning that Saylor is currently sitting on an… pic.twitter.com/0kGcGk3agm
— Arkham (@arkham) February 19, 2026
With Bitcoin now trading about 12.4% below that level, his unrealized loss is estimated at roughly $6.7 billion. While the dollar amount looks large, the percentage decline is still relatively small by Bitcoin’s historical standards.
Exchange open interest is still near the high end of its historical range, even after the recent drop in price. During the rally toward $100,000, open interest increased quickly. However, as spot price pulled back, derivatives positions did not fall at the same pace.
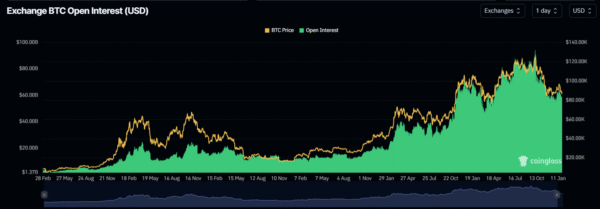
Image Source: CoinGlass
As a result, many positions remain open in the market, thus contributing to price swings. Assuming the OG coin Bitcoin reclaims the $76K mark strongly, short sellers may be forced to close positions. And this sharp rise could push prices higher.
On the other hand, if key support levels break, long positions could be liquidated. In this case, selling pressure could increase.
The current market structure shows that deleveraging is not yet complete. In past mid-cycle pullbacks, open interest usually dropped more sharply. However, that kind of reset remains absent. As a result, many leveraged positions are still active, which means price swings could remain strong in the short term.
On-Chain Data Shows No Forced Selling as BTC Pullback Stays Within Cycle Norms
Wallet clusters linked to Saylor’s treasury show strong internal connections. Large connected addresses suggest centralized control and cold storage separation.
In addition, outbound transfers appear to be internal movements or security adjustments. So far, there are no clear signs of funds moving to exchange wallets. And as such, the risk of forced selling remains low.
Bitcoin has often experienced 20%-40% declines during broader bull markets. In full bear markets, prices have fallen by 70% or more. Compared with those moves, a 12.4% drop below a five-year average cost looks relatively small.
At the same time, the current pullback from recent highs still fits within normal mid-cycle ranges. More so, price behavior does not look like past major breakdowns. Instead, volatility data points more toward consolidation than panic selling.
The MVRV ratio, which compares market value to realized value, has fallen from earlier high levels. The reading is closer to neutral levels, which points to a normal reset.
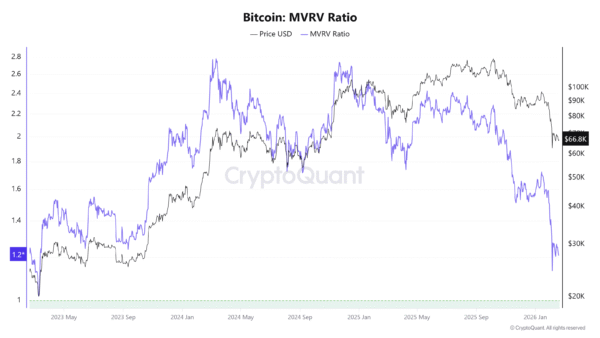
Image Source: CryptoQuant
Meanwhile, data from Coinglass shows that long-term holder supply is still close to cycle highs. When experienced holders increase their supply, it usually shows confidence. In past cycles, sharp drops in this metric came before major tops.
However, current data does not show wide selling from long-term holders. A large unwind like previous peaks has not appeared. With this in mind, current behavior looks more like a slowing of demand than a full exit from the market.
Saylor’s Bitcoin Position Faces Paper Loss as Market Tests Key Levels
Retail investors often focus mainly on the size of the dollar loss, while institutional investors place more weight on long-term time horizon and normal market volatility. From that perspective, five and a half years of steady buying spans multiple bull and bear cycles, which changes how short-term losses are viewed.
Bitcoin often moves 20% to 30% during broader uptrends. For that reason, a 12% gap below the average cost does not automatically signal that the strategy has failed. Custody remains stable, and the capital behind the position appears positioned for the long term rather than short-term trading.
Market direction now depends on three key factors. A clear drop in open interest could reduce selling pressure and calm volatility. A strong move back above $76,000 could shift short-term momentum higher. On the other hand, a break below key support levels could trigger additional liquidations and increase downside pressure.
