
HBAR price drops 16% weekly but holds flat post-breakdown, leading to “bear trap” speculation due to weak follow-through and crowded short positions.
This kind of crowded positioning often fuels the conditions. It creates a bear trap risk. This is where the price briefly turns around upwards. It forces shorts to close their positions, losing money. The price breakdown of the HBAR has happened, yes. But this is a dangerous positioning. It is not safe to assume that the move will go uninterrupted.
HBAR’s Breakdown and Potential for a Bear Trap Rebound
One move could cause an HBAR price rebound. This could strike at short liquidations. The key reason for a bear trap is contained in the price chart. HBAR broke down below the neckline. However, the follow through has been weak. At the same time, we have the Relative Strength Index (RSI) which shows an interesting pattern. The RSI is a momentum measure used to gauge the price momentum. It indicates whether an asset is oversold or overbought.
Related Reading: HBAR News: HBAR Market Cap Surges Past $8.3B Amid Strong On-Chain Growth | Live Bitcoin News
Hedera (HBAR) has fallen 16% over the last week. This resulted after a head and shoulders pattern completed. However, the price held flat for the past 24 hours. This caused speculation of a possible “bear trap.” Despite being highly shorted, some analysts believe that HBAR could briefly turn around to the upside. The fall came on the token breaching a key support level.
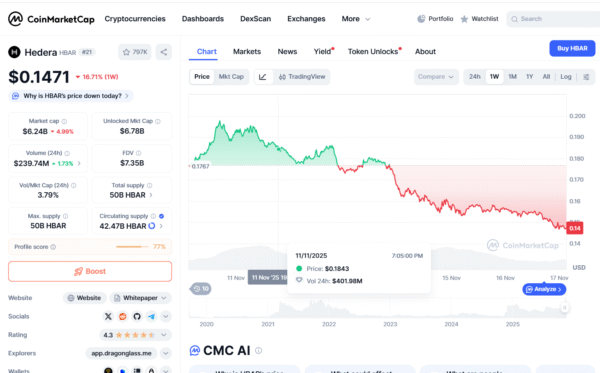
As of November 16, 2025, Hedera (HBAR) is trading at $0.14957. Recent trading saw a 0.4% drop. This was to around $0.16 before recovering. Institutional selling was seen at significant resistance levels. Some analysts predict a possible rise to $0.22 in late November. A range of $0.16 to $0.30 is also predicted throughout 2025. This is driven by the growing institutional adoption and network activity.
Recent Price History and Factors Creating Uncertainty
HBAR’s latest price history reveals a profound trend. On November 14, 2025, the same with the price of HBAR following the weakness of Bitcoin. It slipped through an important support level. This level for weeks was protecting it. On November 13, 2025, HBAR dropped 3.5%. It broke key support. This occurred even as institutional ETF inflows were reportedly $68 million.
Despite the bearish head and shoulders pattern, there are a number of factors that generate uncertainty. The price action has been quite flat since the breakdown. Some are observing this as an indication of a possible bear trap. Crowded short positions are also a part. The short exposure by far outweighs the long. This is in the Derivatives Market. Some analysts believe that a price reversal may cause short-sellers to close their positions at a loss.
The buying of interest has also come into existence. After initial signs of net outflows, there were signs of buying interest in the market. Tokens were flowing to exchanges again. This is suggestive of a possible change in sentiment.
Long-term optimism persists. Some analysts are still bullish on the long-term potential of HBAR. They cite its unique technology. Growing adoption by enterprises is also a factor. And its growing ecosystem contributes to this optimism. This combination of technical indicators and fundamental strengths makes the outlook of HBAR a complex one. The potential of a bear trap, fueled by market positioning, is an interesting combination in its price action.
