
Bitcoin is targeting $116,000 amid fresh ETF interest, with traders watching important price levels around $110K. Could volatility be brewing?
Bitcoin price action is heating up again as BTC eyes a move toward the $116,000 level. After bouncing back from weekend lows, the world’s largest cryptocurrency is showing signs of strength.
However, strong resistance and recent ETF outflows are giving traders mixed signals.
Still, many are watching closely as Bitcoin price eyes $116K.
Traders Watch Bitcoin Price at $116K
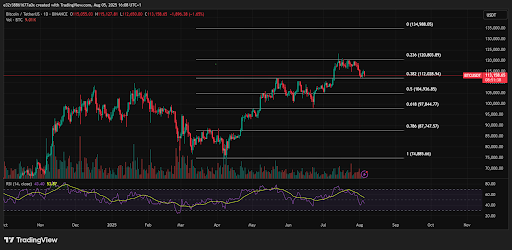
Bitcoin (BTC) started the week around $112,000 and quickly climbed to challenge the $116,000 zone. According to data from TradingView, the bulls seem to be testing some strong order-book resistance centered around $115,800.
That level also marks the top of a recently filled CME Futures price gap, which is a common technical magnet in crypto trading. Analysts like Rekt Capital have also weighed on this issue, and believe that a clean move above this zone could push BTC to reclaim higher ground.
After completely filling the Daily CME Gap, Bitcoin will now try to exit this Gap in an effort to reclaim the recently levels above
It all starts with a reclaim of ~$116k which is the top of the recently filled Daily CME Gap$BTC #Crypto #Bitcoin https://t.co/B8rGvvPhSk pic.twitter.com/quzEIoUxNW
— Rekt Capital (@rektcapital) August 4, 2025
However, it’s not all clear skies.
Market watchers are also pointing to large bid zones stacked between $112,000 and $110,000. More analysts also expect BTC to dip lower before attempting a true breakout.
“$BTC is going lower before it goes higher,” said crypto trading group Material Indicators on X.
Which Zones Are Worth Watching On Bitcoin’s Charts?
Bitcoin has several areas of support in place, in case sellers gain control. These include $113,800, which is an initial bid wall, as well as the $112,000 zone which is a recent local low.
The $110,500 is a historical bounce level, alongside $109,000, which used to be Bitcoin’s old all-time high
According to Trader Cipher X, “If downside gets swept first, expect a bounce near $110.5K.” This kind of scenario would align with the market’s habit of shaking out weak hands before rallying.
Bitcoin ETFs and Market Sentiment
Beyond technicals, institutional behavior is also weighing on the market and spot Bitcoin exchange-traded funds (ETFs) are once again under the microscope.
On Friday, U.S. spot Bitcoin ETFs posted outflows of $812 million, which is the second-largest on record. While this might look like a bearish signal, trading firm QCP Capital believes that it could be part of the shakeout before the boom.
“Historically, post-rally shakeouts that flush out excess leverage often lead to renewed accumulation,” QCP noted.
The data also seems to back this up. Over the weekend, open interest on Bitcoin futures hit its lowest levels since July 10. This indicates that leveraged players were pushed out.
That kind of cleanup often sets the stage for more stable upward moves.
QCP added that Monday’s ETF netflows would be important for gauging sentiment. Positive flows could be a signal of a rebound in institutional interest, while further outflows might delay a bullish breakout.
In all, while some analysts are leaning bearish short term, others see the ongoing price action as a setup for a surprise upside move.
While a dip to $110K or even $109K could shake the market briefly, many traders believe Bitcoin still has the strength to push higher before year’s end.

