
Zcash fell 14% after a seven-year high, with technical signals pointing to a possible correction as support levels attract buyers.
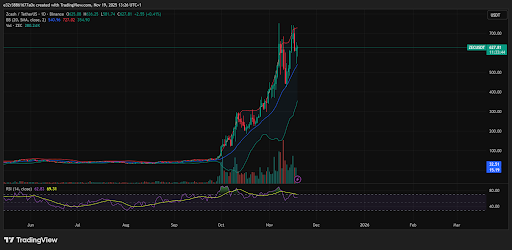
Zcash has been among the top performers this year. Its price surged to over $730 in early November.
The asset now trades near $575 and is creating questions about whether the rally has peaked or a buying opportunity still exists.
Zcash Price Pulls Back After Strong Rally
ZEC recently experienced a drop of more than 14% in a single day. Just two months ago, it traded around $50. However, the sudden increase caught many investors by surprise.
From October to early November, ZEC climbed steadily and eventually peaked at a seven-year high.
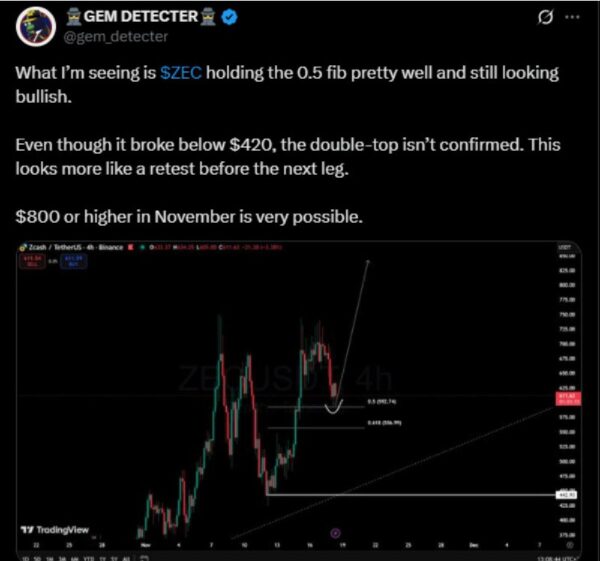
The decline is similar to how the general market has performed lately. Still, despite losses, some analysts are optimistic and are predicting rises towards $800 or even $1,800 in the next few months.
As of writing, buyers are now defending the $575 to $580 zone. This area acted as support during prior rallies, but the Relative Strength Index (RSI) now indicates overbought conditions at 78 and is showing more downside risk.
Short-Term Technical Outlook
ZEC currently trades within an ascending parallel channel. The price currently sits near the channel midline and channels often contain corrective moves. In other words, a breakdown could be likely from here.
The MACD and RSI are both showing bearish divergences and are supporting a possible drop.
This being said, if ZEC loses support at $575, it could fall to $540 in the next few days. Traders are watching the $608 mark as a resistance point. Staying below this level may confirm the bearish scenario.
The daily pivot lies near $604 and support levels currently sit at $582.7 or around $540. Resistance seems clustered near $626 and $724 and investors need to observe these levels for the right entry and exit points.
Related Reading: Hayes Claims Zcash Could Overtake XRP After 43% Surge
Intraday and Momentum Insights
On hourly charts, ZEC is showing neutral momentum. The price currently hovers near the 20-hour and 50-hour EMAs and the RSI sits near 48. This indicates that neither bulls nor bears dominate and minor bullish attempts are occurring on the 15-minute charts.
Through it all, short-term traders are attempting to push higher but clear breakouts have not yet shown up.
Overall, candlestick patterns are showing a phase of consolidation after a strong rally.
Future Scenarios and Strategies
ZEC may continue correcting before stabilising. Short-term drops could reach $540 if support fails. On the upside, breaking $626 could show fresh buying interest.
Investors with long-term plans can consider scaling their holdings during pullbacks, while short-term traders should focus on intraday EMA lines and pivot levels.
In all, this combination of overbought conditions, high volatility and historical peak prices makes ZEC a watchlist asset rather than a guaranteed profit play.
This being said, investors should consider timing entry points and respecting support zones as the most effective approach for making profits off the market.
