- Litecoin is facing a major resistance near the $55 zone against the US Dollar.
- LTC price is now trading near $53.50 and the 55 simple moving average (4-hours).
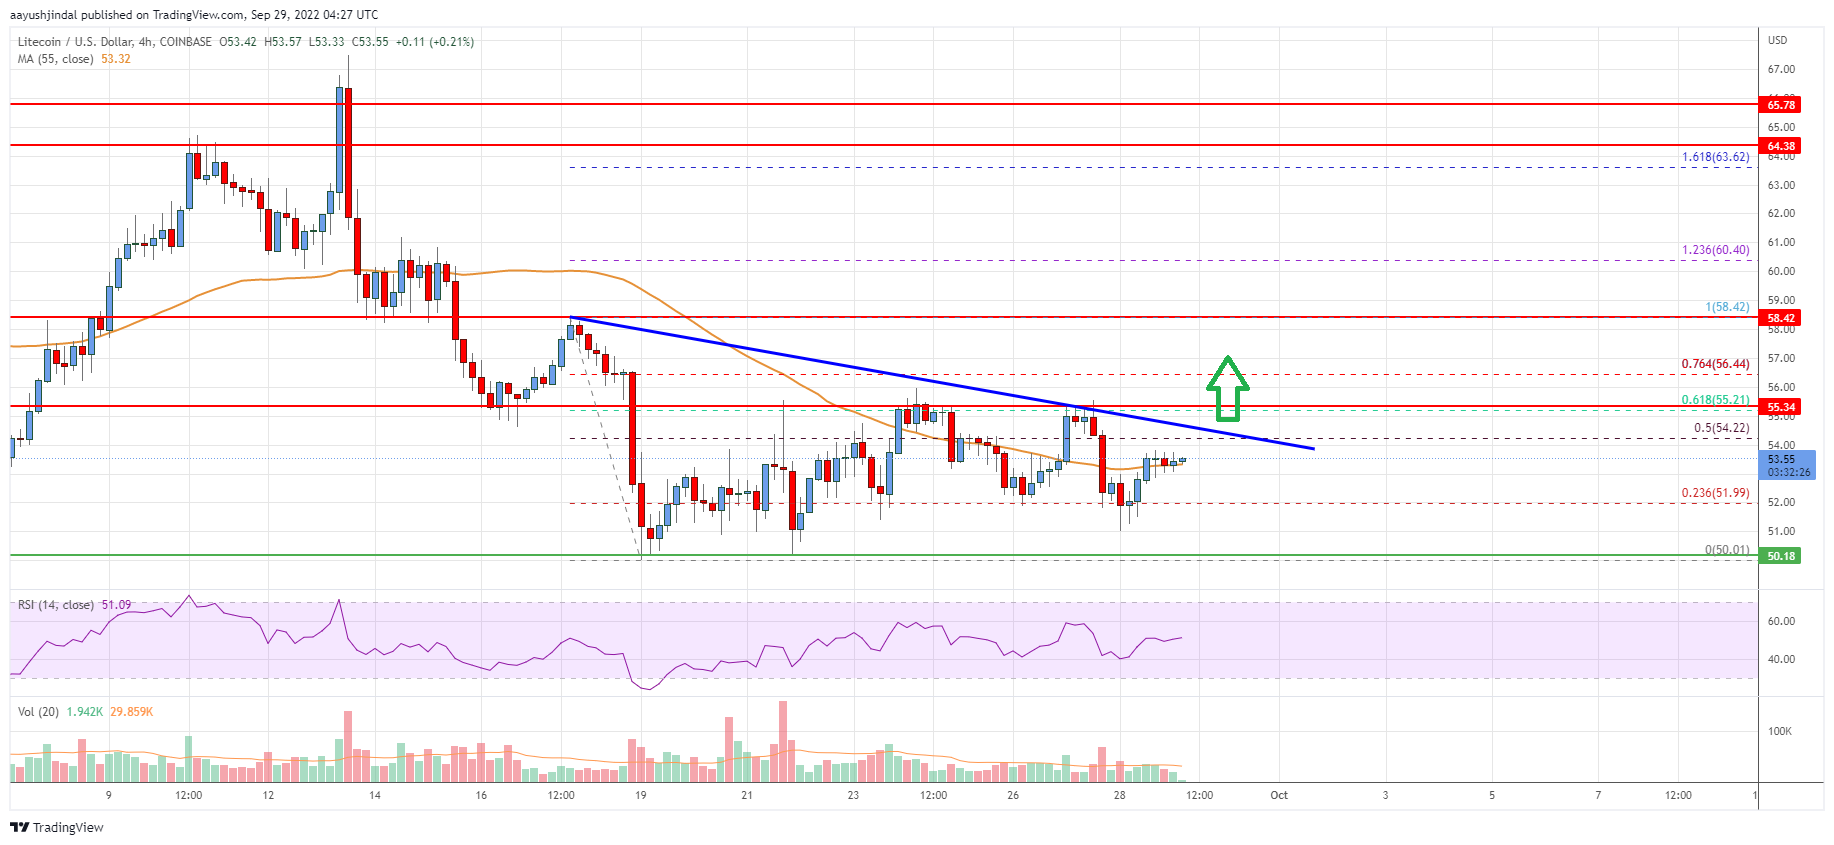
- There is a key bearish trend line forming with resistance near $54.25 on the 4-hours chart of the LTC/USD pair (data feed from Coinbase).
- The pair could start a decent upward move if it clears the $54.25 and $55 levels.
Litecoin price is struggling below $55 against the US Dollar, similar to bitcoin. LTC price could resume its decline if there is no clear move above $55.
Litecoin Price Analysis
In the past few days, there was a fresh decline in bitcoin, ethereum, ripple, and litecoin against the US Dollar. LTC seems to be forming a base above the $50 level.
The last swing low was formed near $50.01 and it is now correcting losses. There was a move above the $51.20 and $52.00 resistance levels. The price even spiked above the 50% Fib retracement level of the key drop from the $58.40 swing high to $50.00 low.
However, the bears seem to be active below the $54.25 and $55 levels. The price is now trading near $53.50 and the 55 simple moving average (4-hours).
On the upside, the price is facing resistance near the $54.25 level. There is also a key bearish trend line forming with resistance near $54.25 on the 4-hours chart of the LTC/USD pair. The next major resistance sits near the $55 level.
The 61.8% Fib retracement level of the key drop from the $58.40 swing high to $50.00 low is also near the $55 zone. A clear move above the $55 level could pump the price towards the $58 level or even $60.
On the downside, an immediate support is near the $52 level. The next key support is near the $50 level. If there is a downside break below the $50 support, the price could accelerate lower towards the $45 level in the near term.
Looking at the chart, litecoin price is clearly trading near $53.50 and the 55 simple moving average (4-hours). Overall, the price could start a decent upward move if it clears the $54.25 and $55 levels.
Technical indicators
4 hours MACD – The MACD for LTC/USD is now losing pace in the bearish zone.
4 hours RSI (Relative Strength Index) – The RSI for LTC/USD is now above the 50 level.
Key Support Levels – $52 and $50
Key Resistance Levels – $54.25 and $55.


Leave a Reply
You must be logged in to post a comment.