- Litecoin is showing bearish signs and trading above $75 against the US Dollar.
- LTC price is now trading below $85 and the 55 simple moving average (4 hours).
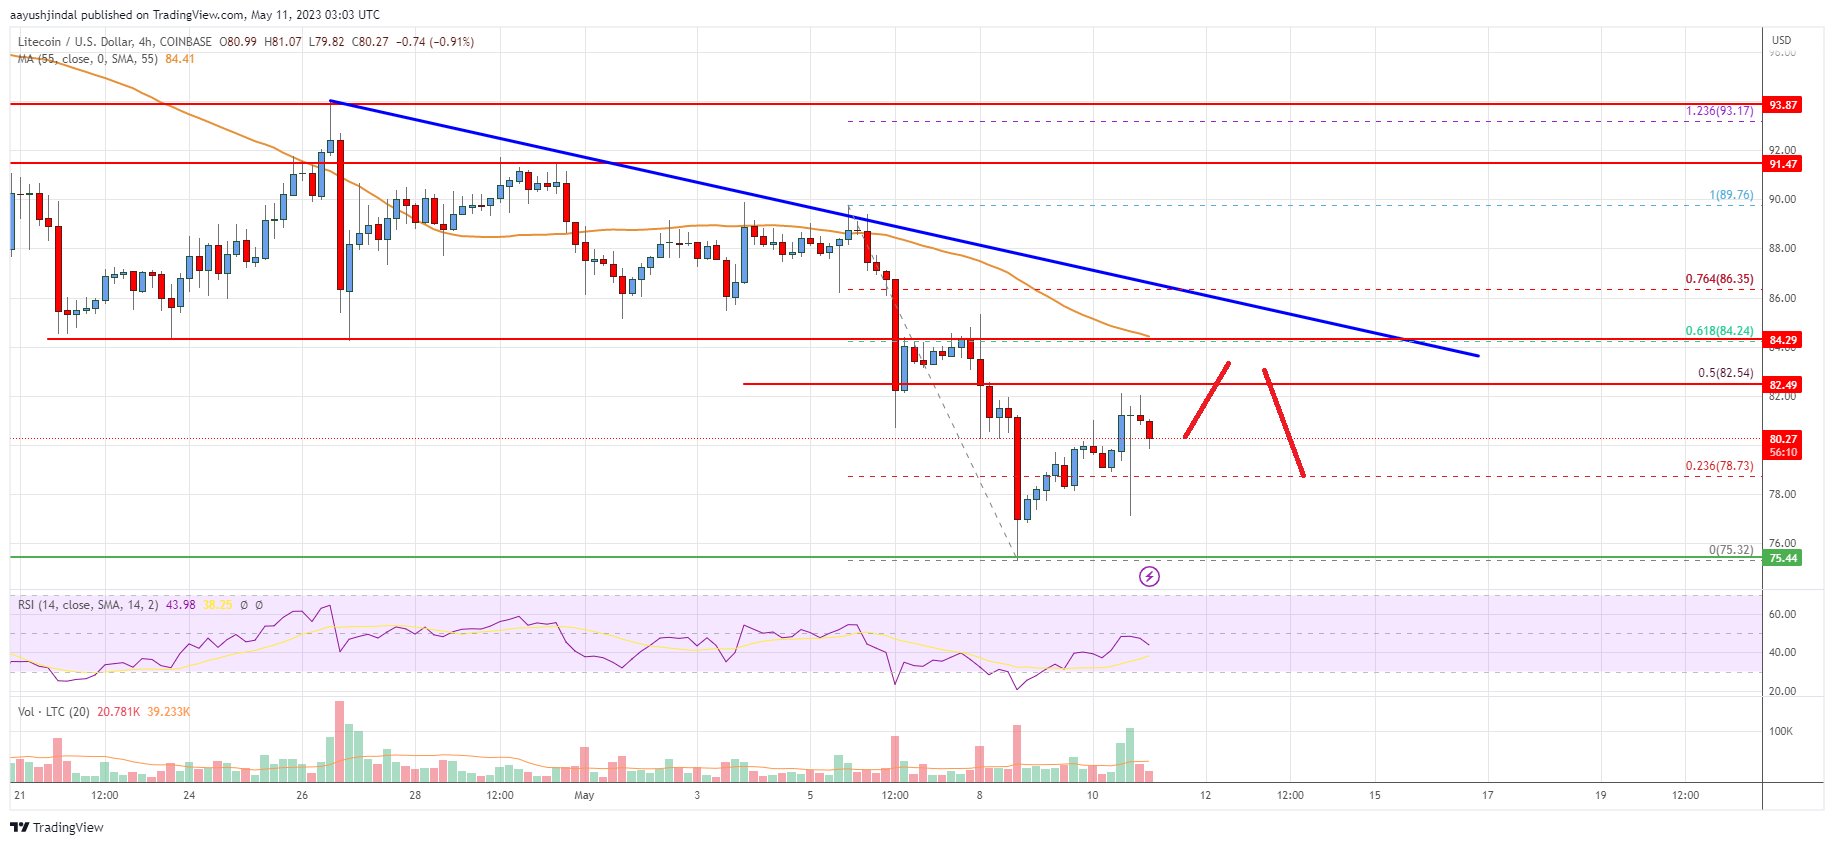
- There is a key bearish trend line forming with resistance near $84.8 on the 4-hour chart of the LTC/USD pair (data feed from Coinbase).
- The pair could start a decent increase if it clears the $85 resistance zone.
Litecoin price is struggling below $85 against the US Dollar, similar to Bitcoin. LTC price could continue to decline if it stays below the $85 resistance zone.
Litecoin Price Analysis
In the past few hours, there was a short-lived recovery in Bitcoin, Ethereum, Ripple, and Litecoin against the US Dollar. Earlier, LTC settled below the $85 resistance zone to move into a bearish zone.
The price broke the $80 support zone and tested the $75 support. A low is formed near $75.32 and the price is now attempting a recovery wave. There was a move above the 23.6% Fib retracement level of the downward move from the $79.76 swing high to the $75.32 low.
It is now trading below $85 and the 55 simple moving average (4 hours). On the upside, the price is facing resistance near the $82.50 zone.
The next major resistance is near the $85 level. There is also a key bearish trend line forming with resistance near $84.8 on the 4-hour chart of the LTC/USD pair. The trend line is close to the 61.8% Fib retracement level of the downward move from the $79.76 swing high to the $75.32 low.
A clear move above the $85 level could pump the price toward the $92 level or even $95. The next major resistance could be $100.
On the downside, immediate support is near the $78 level. The next key support is near the $75 level. If there is a downside break below the $75 support, the price could accelerate lower toward the $70 level in the near term.

Looking at the chart, Litecoin price is clearly trading below $85 and the 55 simple moving average (4 hours). Overall, the price could continue to move down if it stays below the $85 resistance zone.
Technical indicators
4 hours MACD – The MACD for LTC/USD is now losing pace in the bearish zone.
4 hours RSI (Relative Strength Index) – The RSI for LTC/USD is now below the 50 level.
Key Support Levels – $78.00 and $75.00.
Key Resistance Levels – $82.50 and $85.00.


Leave a Reply
You must be logged in to post a comment.