
- Litecoin price gained bullish momentum above the $45.00 and $50.00 resistance levels against the US Dollar.
- LTC price traded to a new monthly high at $58.07 and settled above the 55 simple moving average (4-hours).
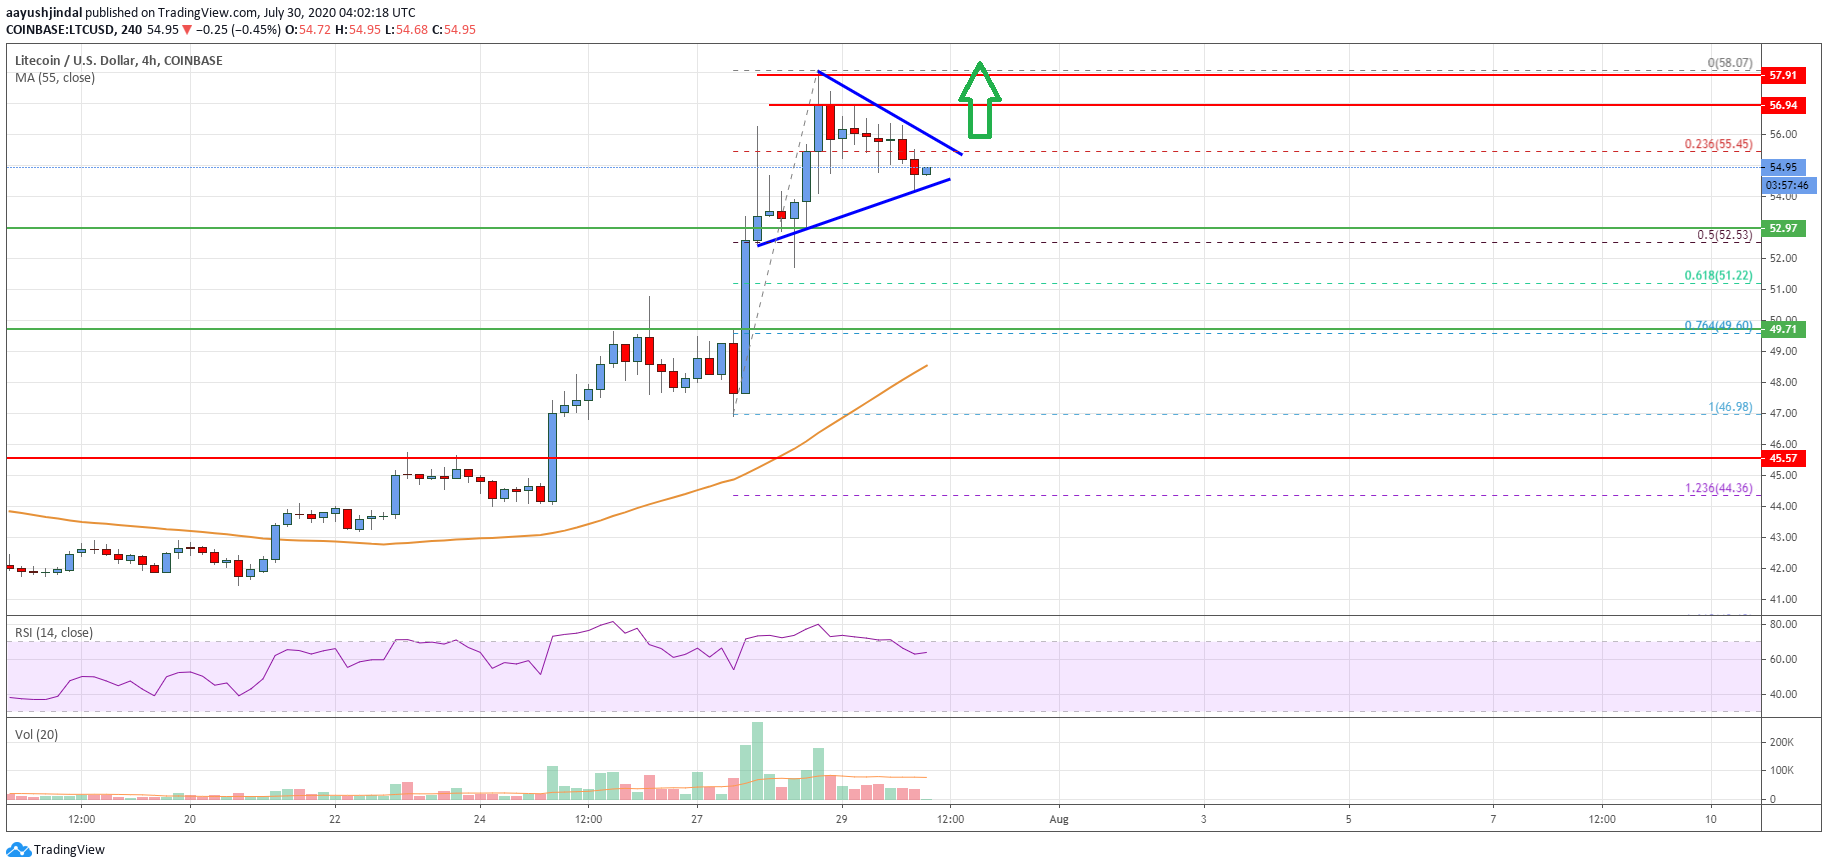
- There is a short-term contracting triangle forming with resistance near $55.50 on the 4-hours chart of the LTC/USD pair (data feed from Coinbase).
- The pair could start a fresh rally if it clears the $55.50 and $56.00 resistance levels in the near term.
Litecoin price is trading in a strong uptrend above $50.00 against the US Dollar, similar to bitcoin. LTC price is likely to continue higher towards $60.00 as long as it is above $52.00.
Litecoin Price Analysis
In the past few days, there was a strong increase in bitcoin, Ethereum, ripple, and litecoin against the US Dollar. Earlier, LTC price broke the key $45.00 resistance area to move into a positive zone.
It opened the doors for more gains above the $50.00 resistance and the 55 simple moving average (4-hours). The price gained traction and climbed above the $52.00 and $55.00 resistance levels. A new monthly high is formed near $58.07 and the price recently corrected lower.
It broke the $56.00 level, plus traded below the 23.6% Fib retracement level of the recent increase from the $46.98 swing low to $58.07 high. At the moment, there is a short-term contracting triangle forming with resistance near $55.50 on the 4-hours chart of the LTC/USD pair.
If the pair breaks the triangle resistance, it could start a fresh increase above $55.50. The first major resistance is near the $57.00 level. The main hurdle is near the $58.00 level, above which the price could rally towards the $60.00 level. Any further gains might call for a test of the $62.00 level.
Conversely, the price may perhaps fail to clear the $55.50 resistance. An initial support is near the $54.00 level and the tringle lower trend line. If there is a downside break, the price could test the $52.50 and $52.00 support levels.
Looking at the chart, litecoin price is consolidating gains above the $54.00 and $52.00 support levels. In the short-term, there could be a downside correction, but the price is likely to resume its upside unless there is a close below $50.00.
Technical indicators
4 hours MACD – The MACD for LTC/USD is currently losing momentum in the bullish zone.
4 hours RSI (Relative Strength Index) – The RSI for LTC/USD is now well above the 60 level.
Key Support Levels – $54.00 and $52.00.
Key Resistance Levels – $55.50 and $57.00.


Leave a Reply
You must be logged in to post a comment.