- Litecoin price gained a strong bullish momentum after it broke the $48.00 resistance against the US Dollar.
- LTC price traded towards the $60.00 resistance and it is currently correcting lower.
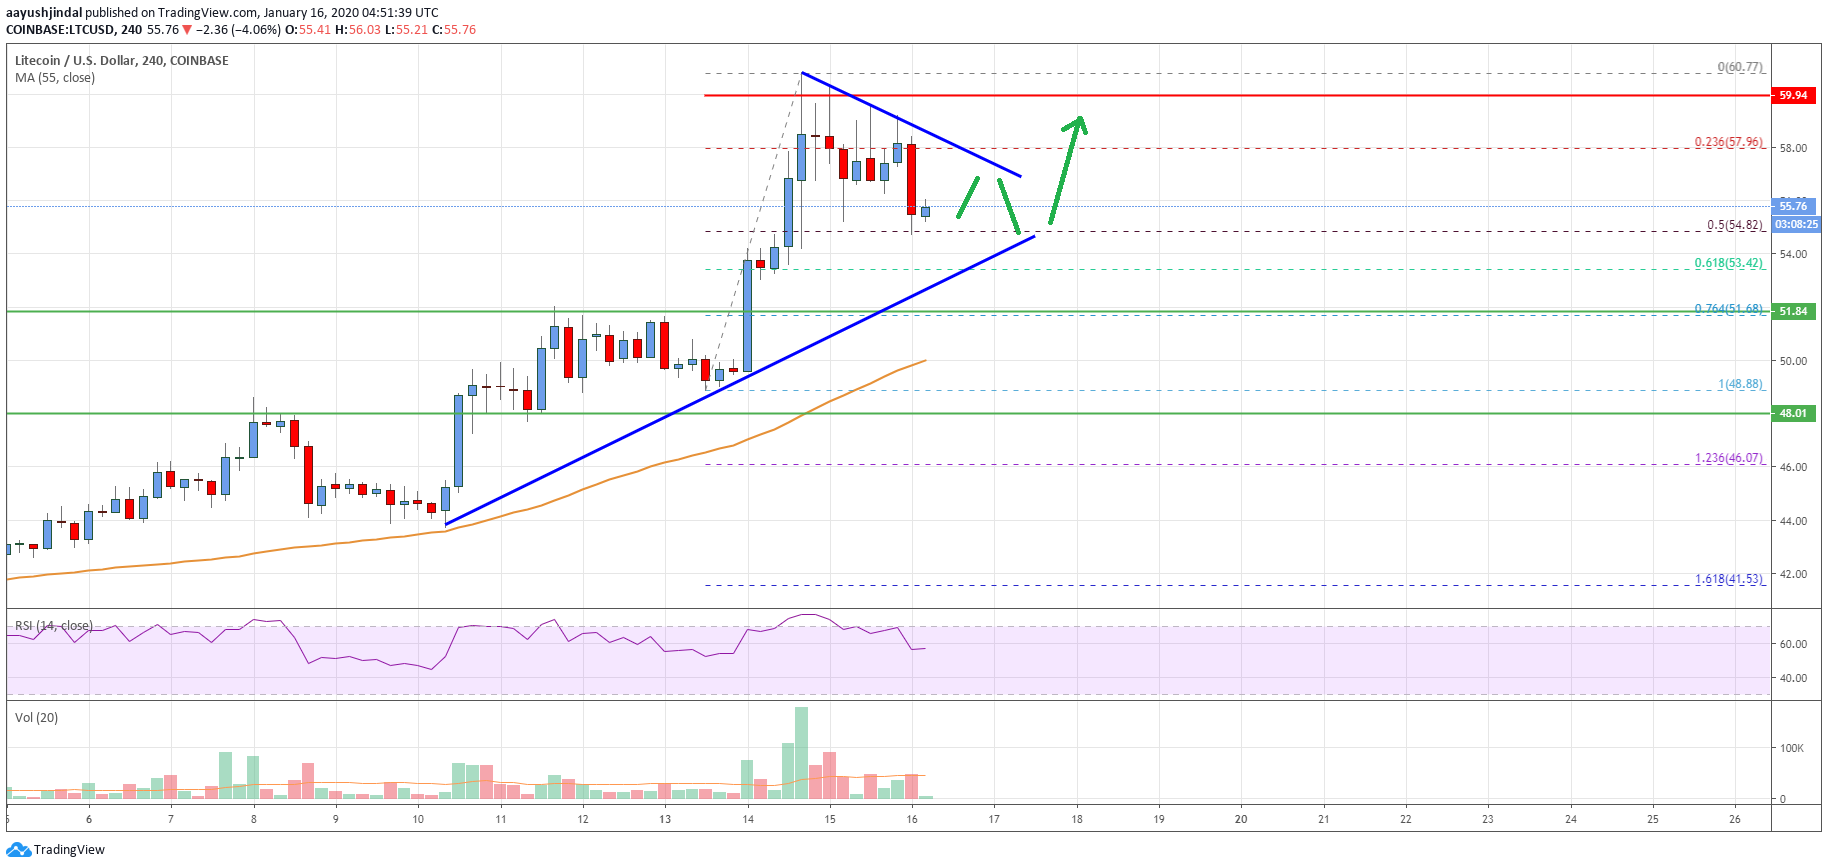
- There is a key contracting triangle forming with support near $54.00 on the 4-hours chart of the LTC/USD pair (data feed from Coinbase).
- The pair remains well supported on the downside near $52.00 and $50.00.
Litecoin price is trading in a bullish zone above $50.00 against the US Dollar, similar to bitcoin. LTC price could consolidate in the short term before a fresh increase to $60.00.
Litecoin Price Analysis
This week, there were strong gains in bitcoin, Ethereum, ripple and litecoin against the US Dollar. LTC price broke the key $48.00 and $50.00 resistance levels to start an uptrend.
Moreover, there was a close above the $50.00 level and the 55 simple moving average (4-hours). The bulls gained traction and the price rallied above the $55.00 and $58.00 resistance levels.
Finally, a high is formed near $60.77 and the price started correcting gains. It broke the $58.00 support level, and even traded below the 23.6% Fib retracement level of the upward leg from the $48.88 low to $60.77 high.
On the downside, an initial support is near the $54.80 level. It coincides with the 50% Fib retracement level of the upward leg from the $48.88 low to $60.77 high.
Additionally, there is a key contracting triangle forming with support near $54.00 on the 4-hours chart of the LTC/USD pair. If there is a downside break below the $54.80 support level and $54.00, there are chances of more losses in the near term.
Then next key support for litecoin price could be near the $51.80 level (the previous breakout zone). The last support for the current uptrend is near $50.00 and the 55 simple moving average (4-hours).
On the upside, an initial resistance is near the $57.50 level and the triangle upper trend line. If there is a clear break above the triangle resistance, the price is likely to rally towards the $60.00 resistance in the near term.
Looking at the chart, litecoin price is clearly correcting gains below $58.00. However, there are many key supports on the downside near $52.00 and $50.00. As long as there is no close below $50.00, the price is likely to climb back above $58.00.
Technical indicators
4 hours MACD – The MACD for LTC/USD is losing pace in the bullish zone.
4 hours RSI (Relative Strength Index) – The RSI for LTC/USD is still well above the 50 level.
Key Support Levels – $54.80 and $51.80.
Key Resistance Levels – $58.00 and $60.00.