
- Litecoin price started a fresh increase from the $125 support zone against the US Dollar.
- LTC price is now trading well above $140 pivot level and the 55 simple moving average (4-hours).
- There was a break above a major contracting triangle with resistance near $140 on the 4-hours chart of the LTC/USD pair (data feed from Coinbase).
- The pair could correct lower, but it is likely to remain stable above $145 and $142.
Litecoin price is showing positive signs above $145 against the US Dollar, similar to bitcoin. LTC price could correct lower, but the overall price action suggests more gains above $155.
Litecoin Price Analysis
This week, there was a decent increase in bitcoin, Ethereum, ripple, and litecoin against the US Dollar. Earlier, LTC formed a base support near the $125 level before it started moving higher.
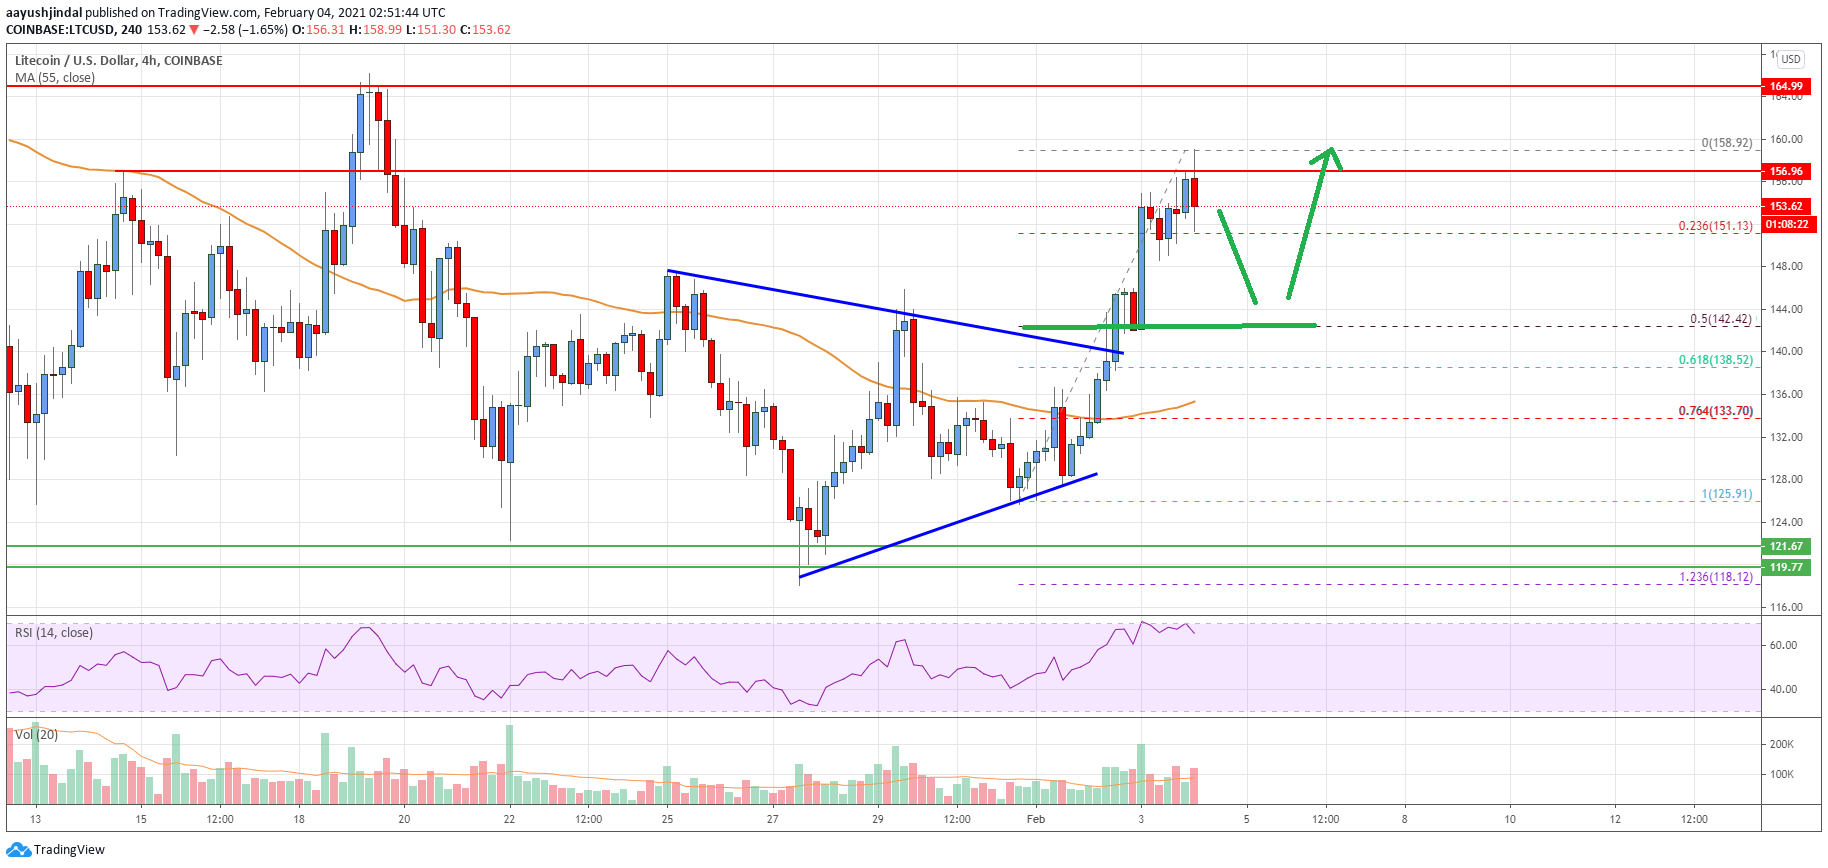
It broke the $130 and $132 resistance levels to move into a positive zone. There was also a break above a major contracting triangle with resistance near $140 on the 4-hours chart of the LTC/USD pair. It opened the doors for more gains above $142 and the price settled above the 55 simple moving average (4-hours).
The price even cleared the $150 resistance, but it is currently facing hurdles near the $155-$158 zone. A high is formed near $158 and the price is currently consolidating gains.
An initial support is near the $150 level. It is close to the 23.6% Fib retracement level of the upward move from the $125 swing low to $158 high. The next major support on the downside could be near the $142 zone (a pivot region).
The 50% Fib retracement level of the upward move from the $125 swing low to $158 high is also near $142. Any more losses might call for a test of the 55 simple moving average (4-hours) at $136.
On the upside, the price is facing a strong resistance near the $155 and $158 levels. A successful break above the $158 level might call for a push towards the $165 level.
Looking at the chart, litecoin price is clearly trading nicely above $140 pivot level and the 55 simple moving average (4-hours). Overall, the price could correct lower, but it is likely to remain stable above $145 and $142 in the near term.
Technical indicators
4 hours MACD – The MACD for LTC/USD is currently losing momentum in the bearish zone.
4 hours RSI (Relative Strength Index) – The RSI for LTC/USD is still well above the 50 level.
Key Support Levels – $150 and $142.
Key Resistance Levels – $155 and $158.


Leave a Reply
You must be logged in to post a comment.