- Litecoin price is facing resistance near the $165 zone against the US Dollar.
- LTC price is now trading below $155 and the 55 simple moving average (4-hours).
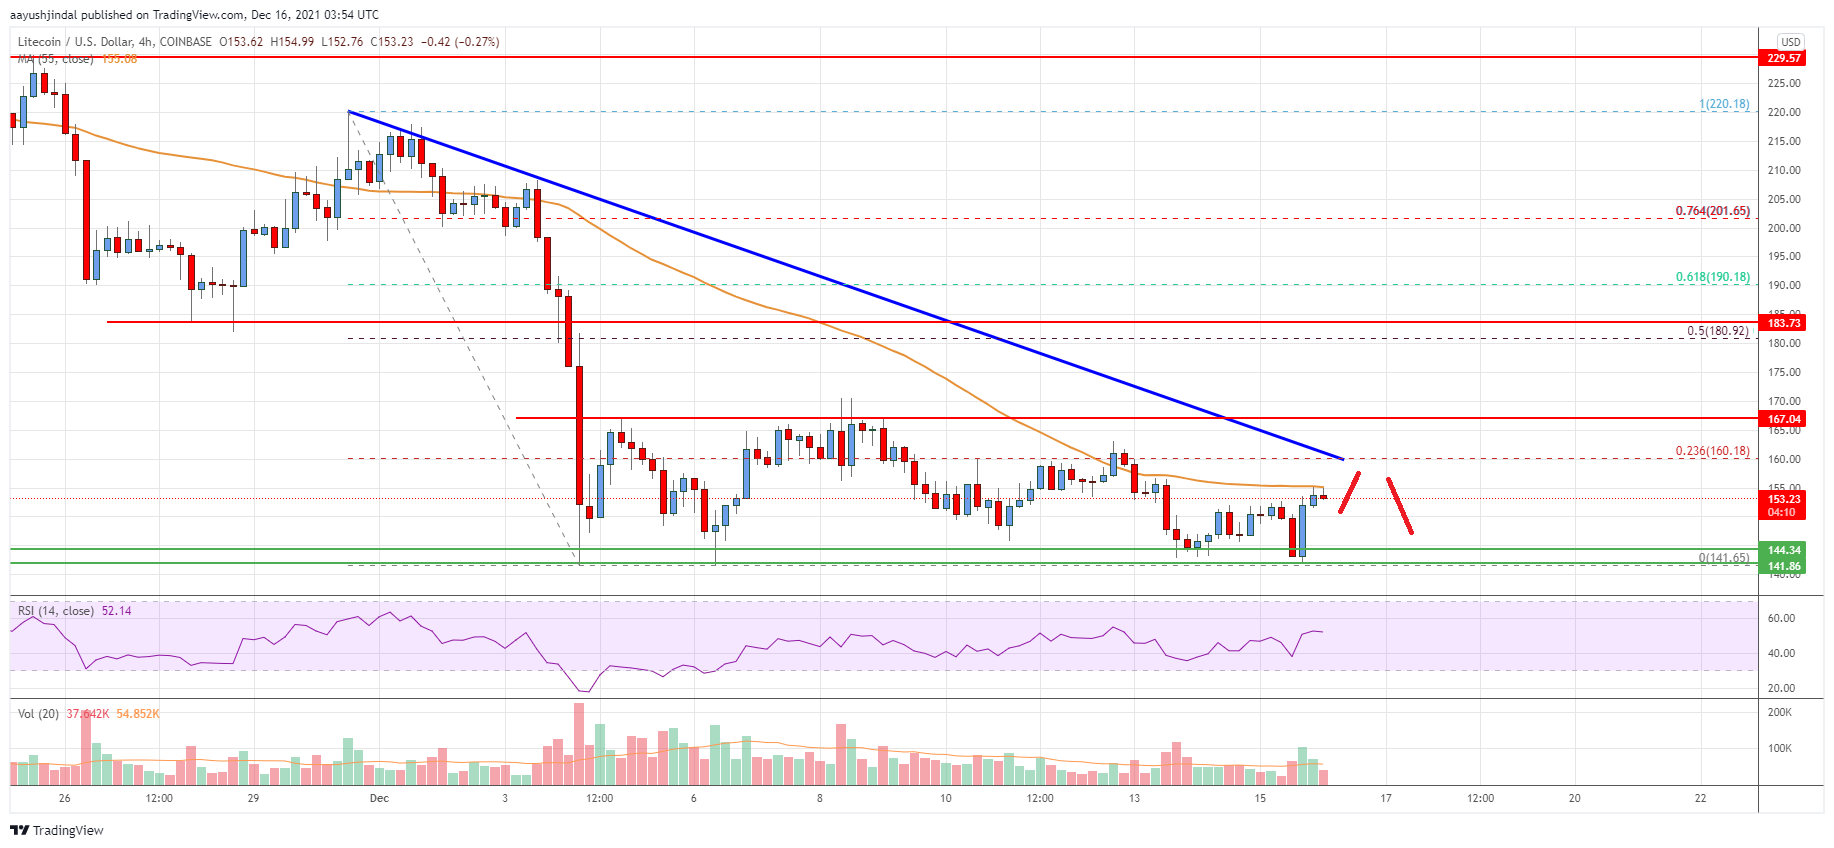
- There is a major bearish trend line forming with resistance near $160 on the 4-hours chart of the LTC/USD pair (data feed from Coinbase).
- The pair could start a fresh decline if it fails to stay above the $142 support.
Litecoin price is consolidating below $165 against the US Dollar, similar to bitcoin. LTC price could resume lower if it breaks the $142 support zone.
Litecoin Price Analysis
This week, there was a fresh decline in bitcoin, ethereum, ripple, and litecoin against the US Dollar. Earlier, LTC struggled to clear the $180 resistance zone and started a fresh decline.
There was a break below the $165 and $155 support levels. The price even dived below the $150 support and the 55 simple moving average (4-hours). A low was formed near the $142 level and the price is now correcting losses.
There was a move above the $150 level. It is now facing resistance near the $155 zone and the 55 simple moving average (4-hours). It is also close to the 23.6% Fib retracement level of the downward move from the $220 swing high to $142 low.
The next key resistance could be $160. There is also a major bearish trend line forming with resistance near $160 on the 4-hours chart of the LTC/USD pair.
The main barrier is now near the $165 level. A move above the $165 level could push the price towards the 50% Fib retracement level of the downward move from the $220 swing high to $142 low. A close above the $165 and $168 levels could open the doors for a decent increase.
In the stated case, the price could rise towards the $200 level in the near term. On the downside, an immediate support is near the $145 level. The first key support is near the $142 level. If there is a downside break the $142 support, the price could visit $130. The next key support is near the $120 level, below which the price could slide towards the $105 level.
Looking at the chart, litecoin price is clearly trading below $160 and the 55 simple moving average (4-hours). Overall, the price could start a fresh decline if it fails to stay above the $142 support in the near term.
Technical indicators
4 hours MACD – The MACD for LTC/USD is slowly gaining pace in the bullish zone.
4 hours RSI (Relative Strength Index) – The RSI for LTC/USD is now just above the 50 level.
Key Support Levels – $150 and $142
Key Resistance Levels – $160 and $165.


Leave a Reply
You must be logged in to post a comment.