- Litecoin is trading in a positive zone above $55 against the US Dollar.
- LTC price is now trading below $60 and the 55 simple moving average (4-hours).
- There is a key bearish trend line forming with resistance near $60 on the 4-hours chart of the LTC/USD pair (data feed from Coinbase).
- The pair could gain bullish momentum if it clears the $60 resistance zone.
Litecoin price is rising above $55 against the US Dollar, similar to bitcoin. LTC price could continue to move up if it remains well bid above the $55 level.
Litecoin Price Analysis
In the past few days, there was a decent increase in bitcoin, ethereum, ripple, and litecoin against the US Dollar. Earlier, LTC formed a base above the $52 level and started a fresh increase.
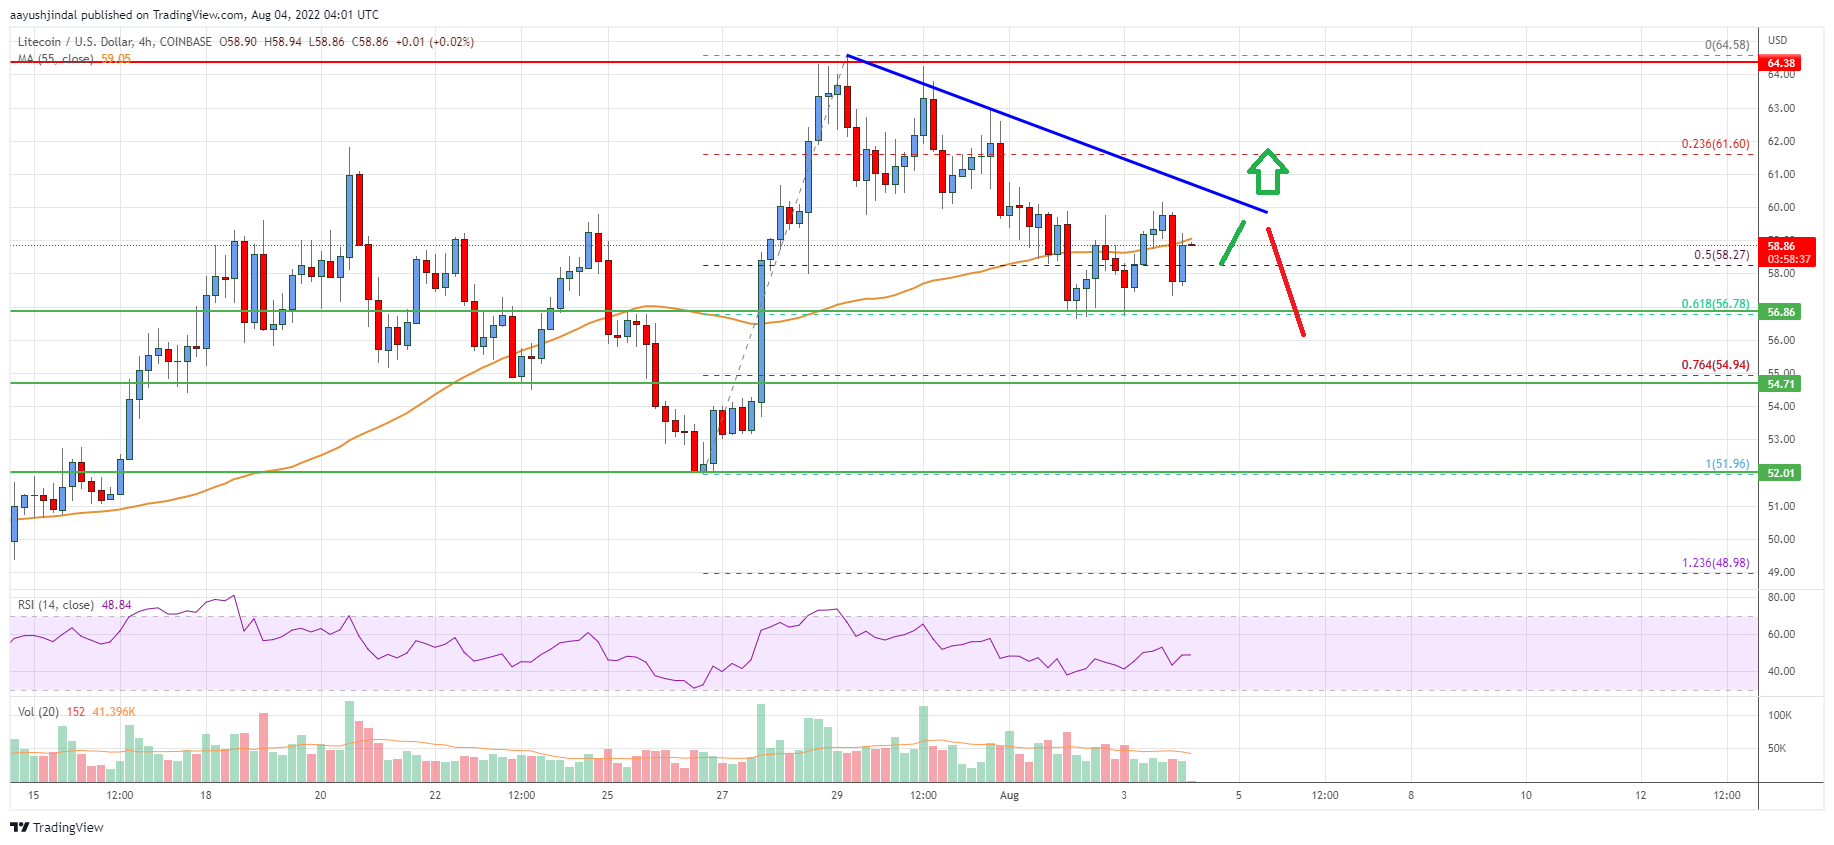
There was a clear move above the $55 and $58 resistance levels. The price even climbed above the $60 level and the 55 simple moving average (4-hours). However, the bears were active near the $65 level. A high was formed near $64.58 before there was a downside correction.
The price declined below the $60 level and the 55 simple moving average (4-hours). It even spiked below 50% Fib retracement level of the upward move from the $51.96 swing low to $64.58 high. However, the bulls were active near the $56.50 level.
The 61.8% Fib retracement level of the upward move from the $51.96 swing low to $64.58 high is acting as a support. On the upside, the price is facing resistance near the $59.80 and $60.00 levels.
There is also a key bearish trend line forming with resistance near $60 on the 4-hours chart of the LTC/USD pair. A clear move above the $60 level could pump the price towards the $65 level. The next major resistance sits near the $70 level.
On the downside, an immediate support is near the $56.50 level. The next key support is near the $55 level. If there is a downside break below the $55 support, the price could accelerate lower towards the $52 level in the near term.

Looking at the chart, litecoin price is clearly trading below $60 and the 55 simple moving average (4-hours). Overall, the price could gain bullish momentum if it clears the $60 resistance zone.
Technical indicators
4 hours MACD – The MACD for LTC/USD is now gaining pace in the bullish zone.
4 hours RSI (Relative Strength Index) – The RSI for LTC/USD is now above the 50 level.
Key Support Levels – $58 and $55
Key Resistance Levels – $60 and $65.


Leave a Reply
You must be logged in to post a comment.