- Litecoin is consolidating losses near the $96 level against the US Dollar.
- LTC price is now trading below $98 and the 55 simple moving average (4 hours).
- There is a key bearish trend line forming with resistance near $97.00 on the 4-hour chart of the LTC/USD pair (data feed from Coinbase).
- The pair could gain bullish momentum if it clears the $97 and $98 resistance levels.
Litecoin price is showing positive signs above $92 against the US Dollar, similar to Bitcoin. LTC price could climb again if there is a clear move above $98.
Litecoin Price Analysis
In the past few sessions, there were mostly range moves in Bitcoin, Ethereum, Ripple, and Litecoin against the US Dollar. Earlier, LTC started a downside correction from the $115 resistance.
The price traded below the $105 and $100 levels. However, the bulls were active near the $92 zone. The price is now consolidating losses and trading above $95. It even spiked a few times above the 23.6% Fib retracement level of the downward move from the $114.98 swing high to the $91.88 low.
However, the bears were active near the $98 resistance zone. It is now consolidating below $98 and the 55 simple moving average (4 hours). On the upside, the price is facing resistance near the $97 level.
There is also a key bearish trend line forming with resistance near $97.00 on the 4-hour chart of the LTC/USD pair. A clear move above the $98 level could push the price toward the $104 level or the 50% Fib retracement level of the downward move from the $114.98 swing high to the $91.88 low.
The next major resistance sits near the $110 level. Any more gains might send the price toward the $115 level. On the downside, initial support is near the $94 level.
The next major support is near the $92 level. If there is a downside break below the $92 support, the price could accelerate lower toward the $82 level in the near term.
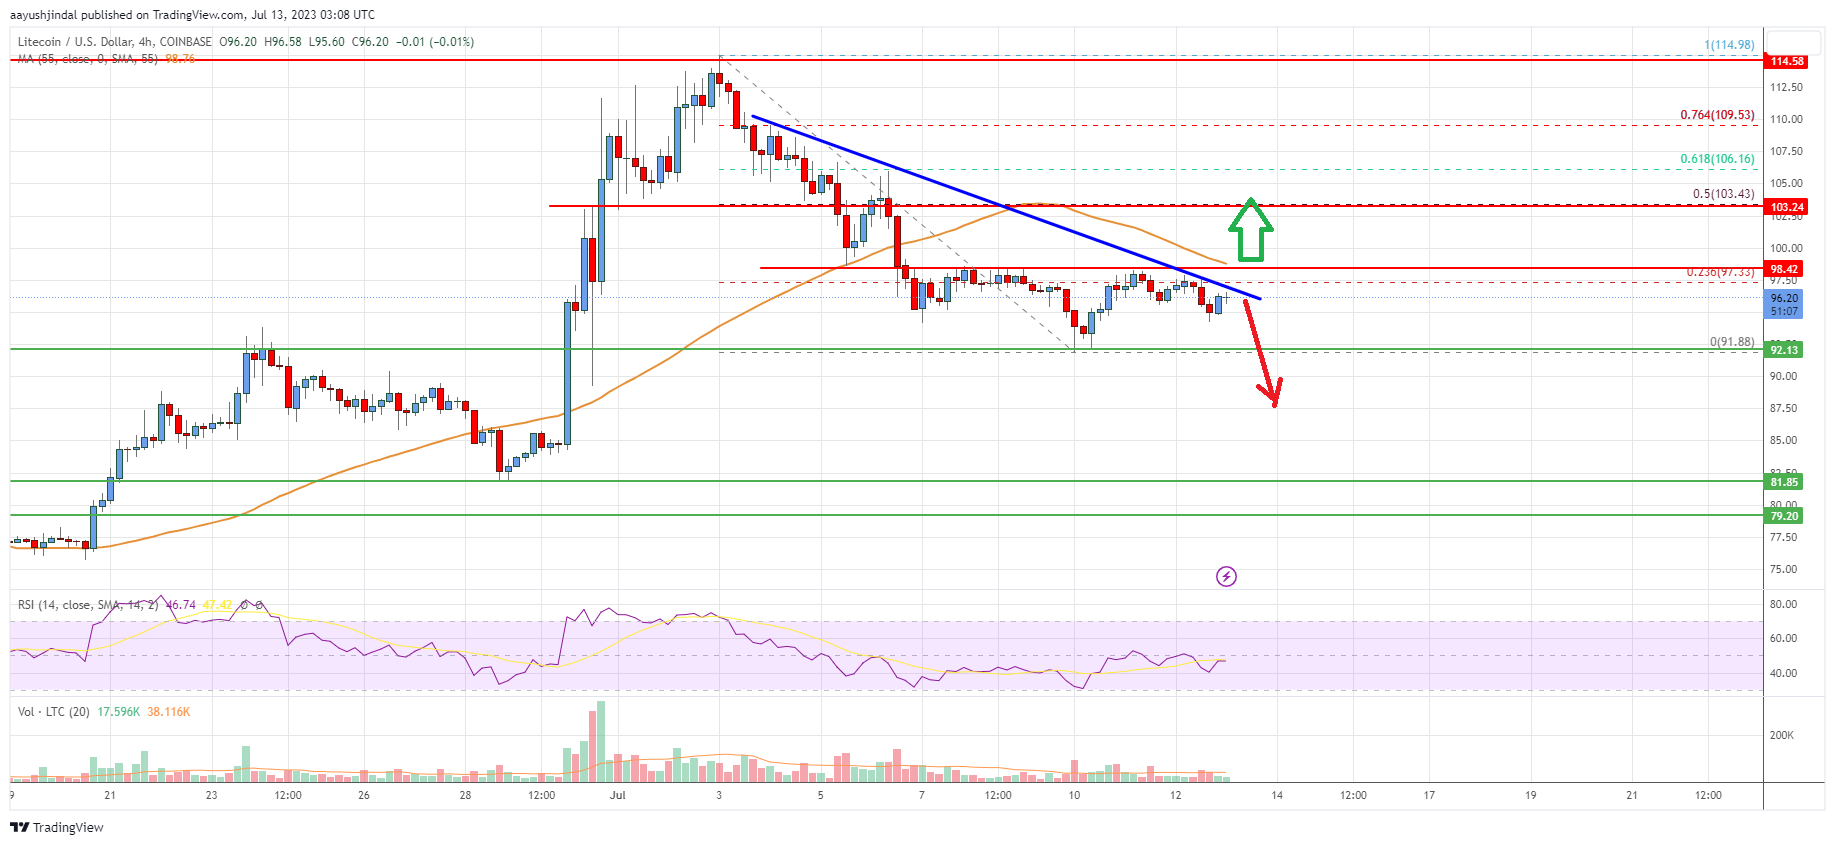
Looking at the chart, Litecoin’s price is trading below $98 and the 55 simple moving average (4 hours). Overall, the price could gain bullish momentum if it clears the $97 and $98 resistance levels.
Technical indicators
4 hours MACD – The MACD for LTC/USD is now losing pace in the bullish zone.
4 hours RSI (Relative Strength Index) – The RSI for LTC/USD is now below the 50 level.
Key Support Levels – $94 and $92
Key Resistance Levels – $97 and $98.