- Ethereum price is eyeing an upside break above the $1,900 resistance against the US Dollar.
- ETH price is now trading below $1,890 and the 55 simple moving average (4 hours).
- There is a key bearish trend line forming with resistance near $1,900 on the 4-hour chart (data feed from Coinbase).
- The pair could climb further if it stays above the $1,825 support zone.
Ethereum price is rising above the $1,850 level against the US Dollar. ETH/USD could rise further if it clears the $1,900 resistance zone.
Ethereum Price Analysis
In the past few days, Ethereum saw a bearish wave from the $2,000 zone against the US Dollar. ETH price declined below the $1,900 level and the 55 simple moving average (4 hours).
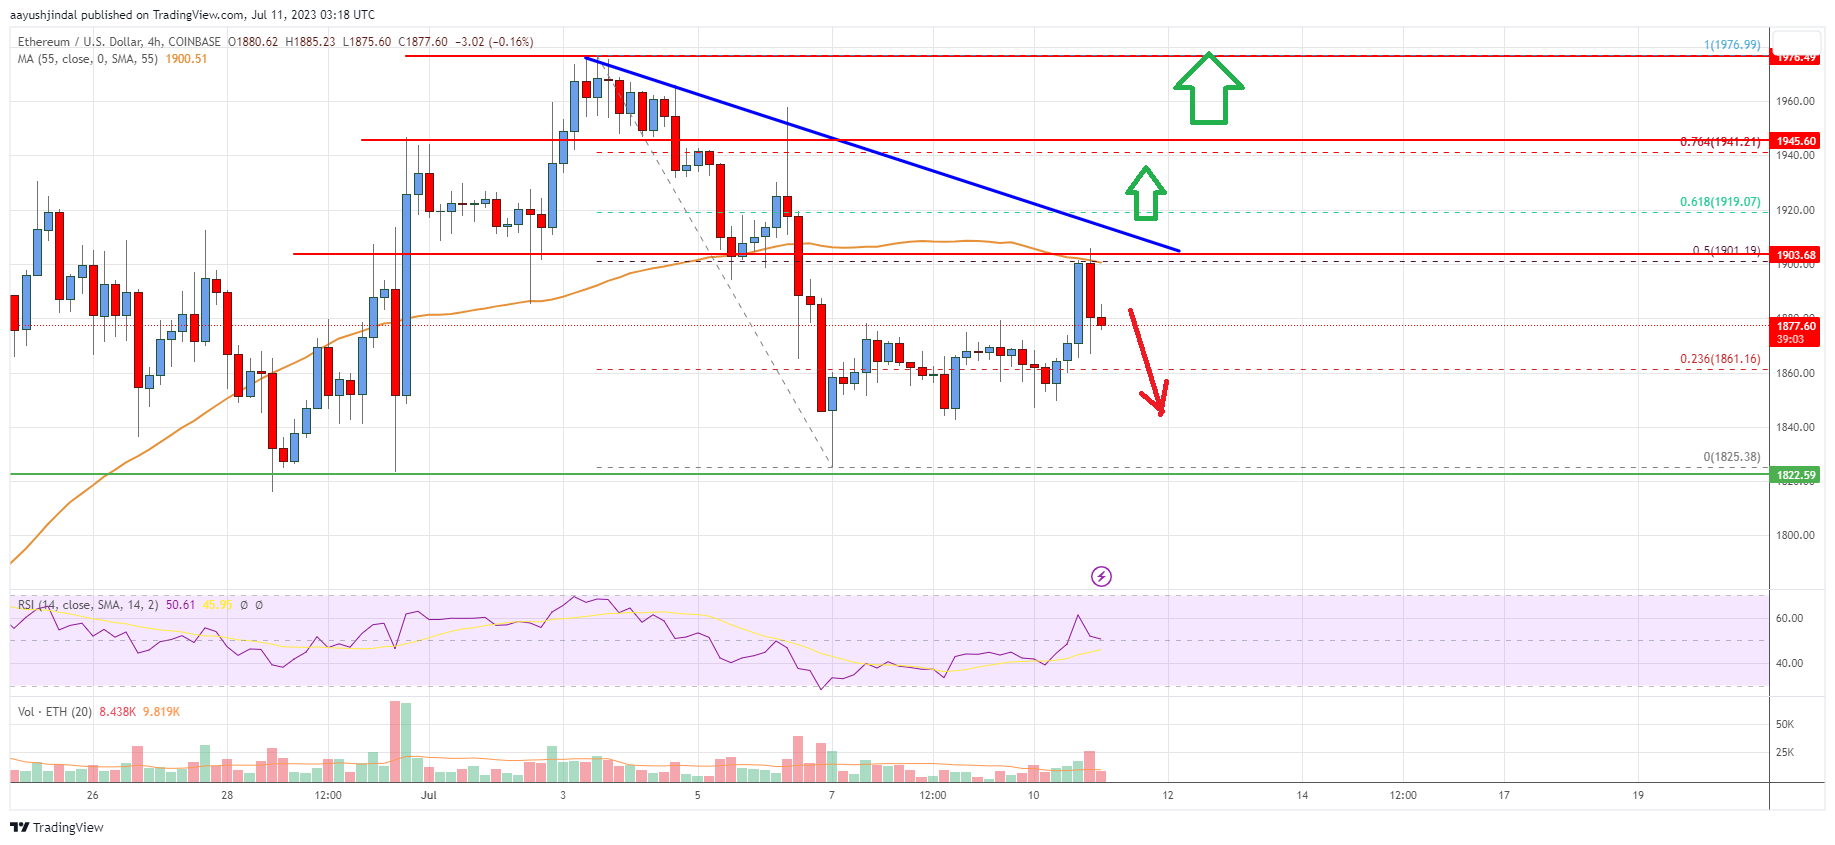
The bears even pushed the price below the $1,850 level. A low was formed near $1,825 and the price is now attempting a fresh increase. There was a move above the $1,850 resistance level. The price broke the 23.6% Fib retracement level of the downward move from the $1,976 swing high to the $1,825 low.
It is now trading below $1,890 and the 55 simple moving average (4 hours). Immediate resistance on the upside is near the $1,900 level. There is also a key bearish trend line forming with resistance near $1,900 on the 4-hour chart.
The trend line is close to the 50% Fib retracement level of the downward move from the $1,976 swing high to the $1,825 low. The next major resistance is near the $1,940 zone. A clear move above the $1,940 level could send the price toward $1,980.
Any more gains could even send the price toward the $2,000 resistance zone or $2,050 in the near term. On the downside, initial support is near the $1,860 level. The next major support is now near the $1,825 level.
A break below the $1,825 support could push the price to $1,760. Any more losses could lead the price toward $1,720 or even $1,700 in the coming days.

Looking at the chart, Ethereum price is clearly trading below the $1,890 zone and the 55 simple moving average (4 hours). Overall, Ether price could climb further if it stays above the $1,825 support zone.
Technical indicators
4 hours MACD – The MACD for ETH/USD is now losing momentum in the bullish zone.
4 hours RSI (Relative Strength Index) – The RSI for ETH/USD is now above the 50 level.
Key Support Levels – $1,860, followed by the $1,825 zone.
Key Resistance$ Levels – $1,900 and $1,940.