
- Ethereum price is moving higher above the $1,850 resistance against the US Dollar.
- ETH price is now trading above $1,850 and the 55 simple moving average (4 hours).
- There is a key bullish trend line forming with support near $1,840 on the 4-hours chart (data feed from Coinbase).
- The pair could climb further if it stays above the $1,770 support zone.
Ethereum price is rising above the $1,850 level against the US Dollar. ETH/USD could rise further if it clears the $1,920 resistance zone.
Ethereum Price Analysis
In the past few days, Ethereum saw a decent increase above the $1,800 level against the US Dollar. ETH price was able to gain pace for a move above the $1,850 level and the 55 simple moving average (4 hours).
The bulls even pushed the price above the $1,880 resistance zone. A high was formed near $1,936 before the bears appeared. There was a minor downside correction below the $1,900 level. The price dipped below the 23.6% Fib retracement level of the upward wave from the $1,620 swing low to the $1,936 high.
Ether’s price is now trading above $1,850 and the 55 simple moving average (4 hours). There is also a key bullish trend line forming with support near $1,840 on the 4-hours chart.
Immediate resistance on the upside is near the $1,900 level. The next major resistance is near the $1,920 zone. A clear move above the $1,920 level could send the price toward $2,000. Any more gains could even send the price toward the $2,120 resistance zone or $2,200 in the near term.
On the downside, initial support is near the $1,840 level and the trend line. The next major support is now near the $1,800 level or the 50% Fib retracement level of the upward wave from the $1,620 swing low to the $1,936 high.
A break below the $1,800 support could push the price to $1,740. Any more losses could lead the price towards $1,650.
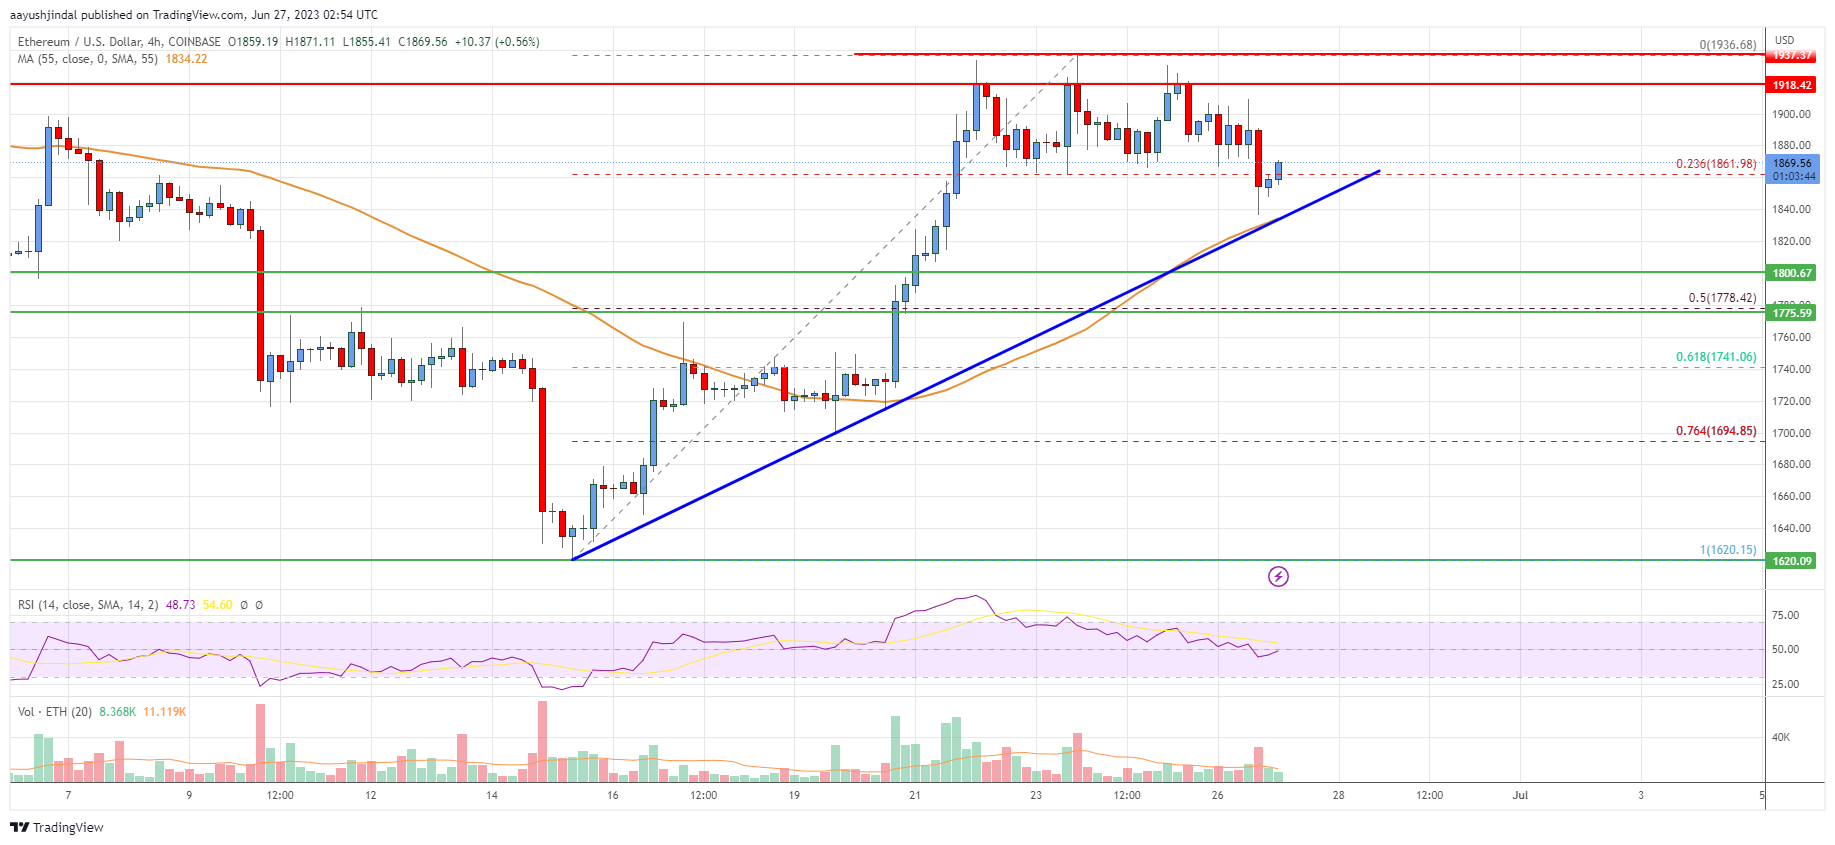
Looking at the chart, Ethereum’s price is trading above the $1,850 zone and the 55 simple moving average (4 hours). Overall, Ether’s price could climb further if it stays above the $1,770 support zone.
Technical indicators
4 hours MACD – The MACD for ETH/USD is now gaining momentum in the bullish zone.
4 hours RSI (Relative Strength Index) – The RSI for ETH/USD is now above the 50 level.
Key Support Levels – $1,840, followed by the $1,800 zone.
Key Resistance$ Levels – $1,920 and $2,000.


Leave a Reply
You must be logged in to post a comment.