- Litecoin price failed to climb above $115 and corrected lower against the US Dollar.
- LTC price is now trading below $110 and the 55 simple moving average (4-hours).
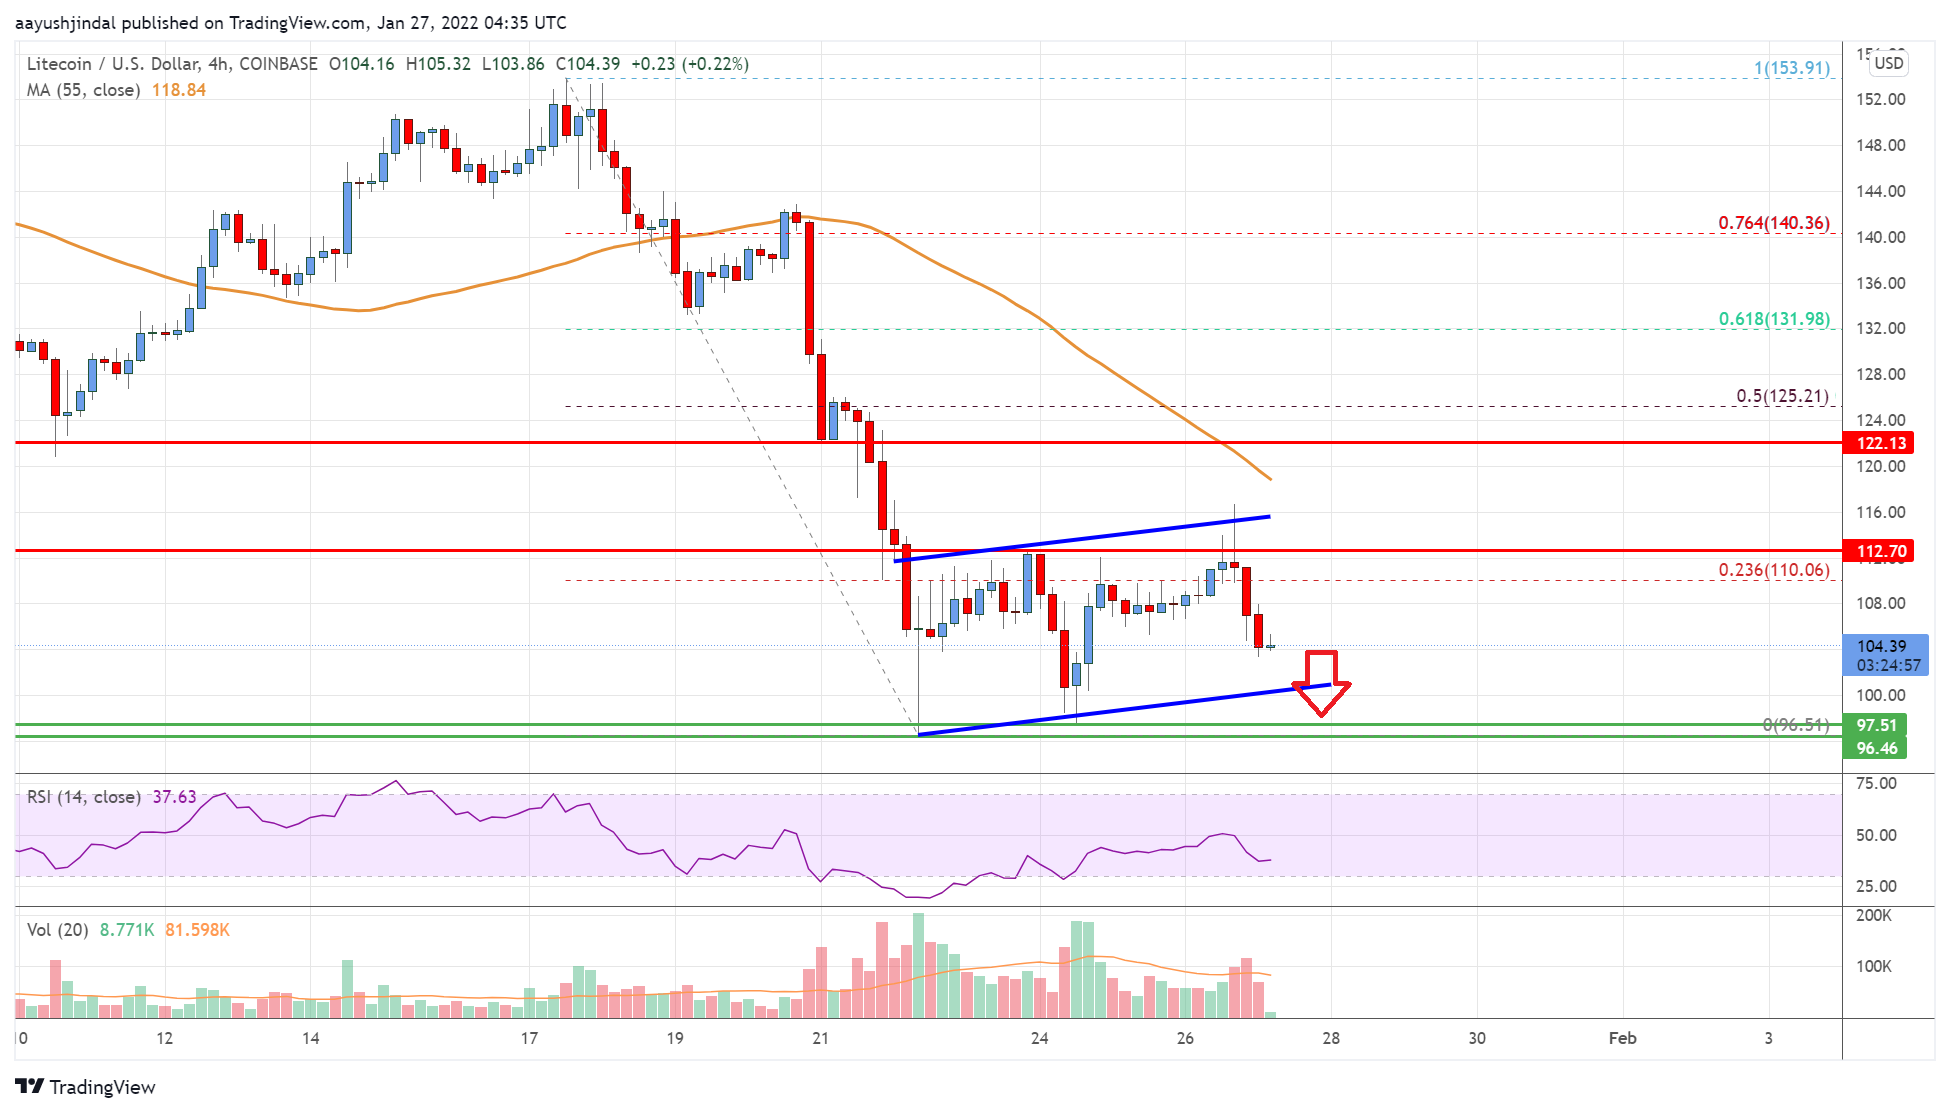
- There is a key rising channel forming with support near $100 on the 4-hours chart of the LTC/USD pair (data feed from Coinbase).
- The pair could continue to move down if it stays below the $120 pivot level.
Litecoin price is struggling below $120 against the US Dollar, similar to bitcoin. LTC price could resume lower if it breaks the $100 support zone.
Litecoin Price Analysis
This week, there was a fresh decline in bitcoin, ethereum, ripple, and litecoin against the US Dollar. Earlier, LTC struggled to clear the $140 resistance zone and started a fresh decline.
There was a break below the $130 and $120 support levels. The price even settled below $120 and $115. A low was formed near $96.50, and the price recently corrected higher. There was a move above the $100 resistance zone.
However, the price failed to gain strength above the $110 level. It failed near the 23.6% Fib retracement level of the recent decline from the $153 swing high to $96.51 low.
The price is now trading below $120 and the 55 simple moving average (4-hours). On the downside, an immediate support is near the $102 level. There is also a key rising channel forming with support near $100 on the 4-hours chart of the LTC/USD pair.
The next key support is near the $100 level. If there is a downside break the $100 support, the price could visit $92. The next major support is near the $88 level, below which the price could slide towards the $75 level.
On the upside, litecoin is facing resistance near the $115 level. The next major resistance for the bulls is near the $125 level. It is near the 50% Fib retracement level of the recent decline from the $153 swing high to $96.51 low. A clear move above the $125 level could pump the price. The next key resistance could be $132.

Looking at the chart, litecoin price is clearly trading below $120 and the 55 simple moving average (4-hours). Overall, the price could continue to move down if there is a break below the $100 support.
Technical indicators
4 hours MACD – The MACD for LTC/USD is slowly gaining pace in the bearish zone.
4 hours RSI (Relative Strength Index) – The RSI for LTC/USD is now below the 50 level.
Key Support Levels – $102 and $100
Key Resistance Levels – $120 and $125.


Leave a Reply
You must be logged in to post a comment.