- Litecoin price rallied sharply and broke many hurdles near $90.00 and $95.00 against the US Dollar.
- LTC price even surged above the $100.00 barrier and traded close to the $108.00 levels.
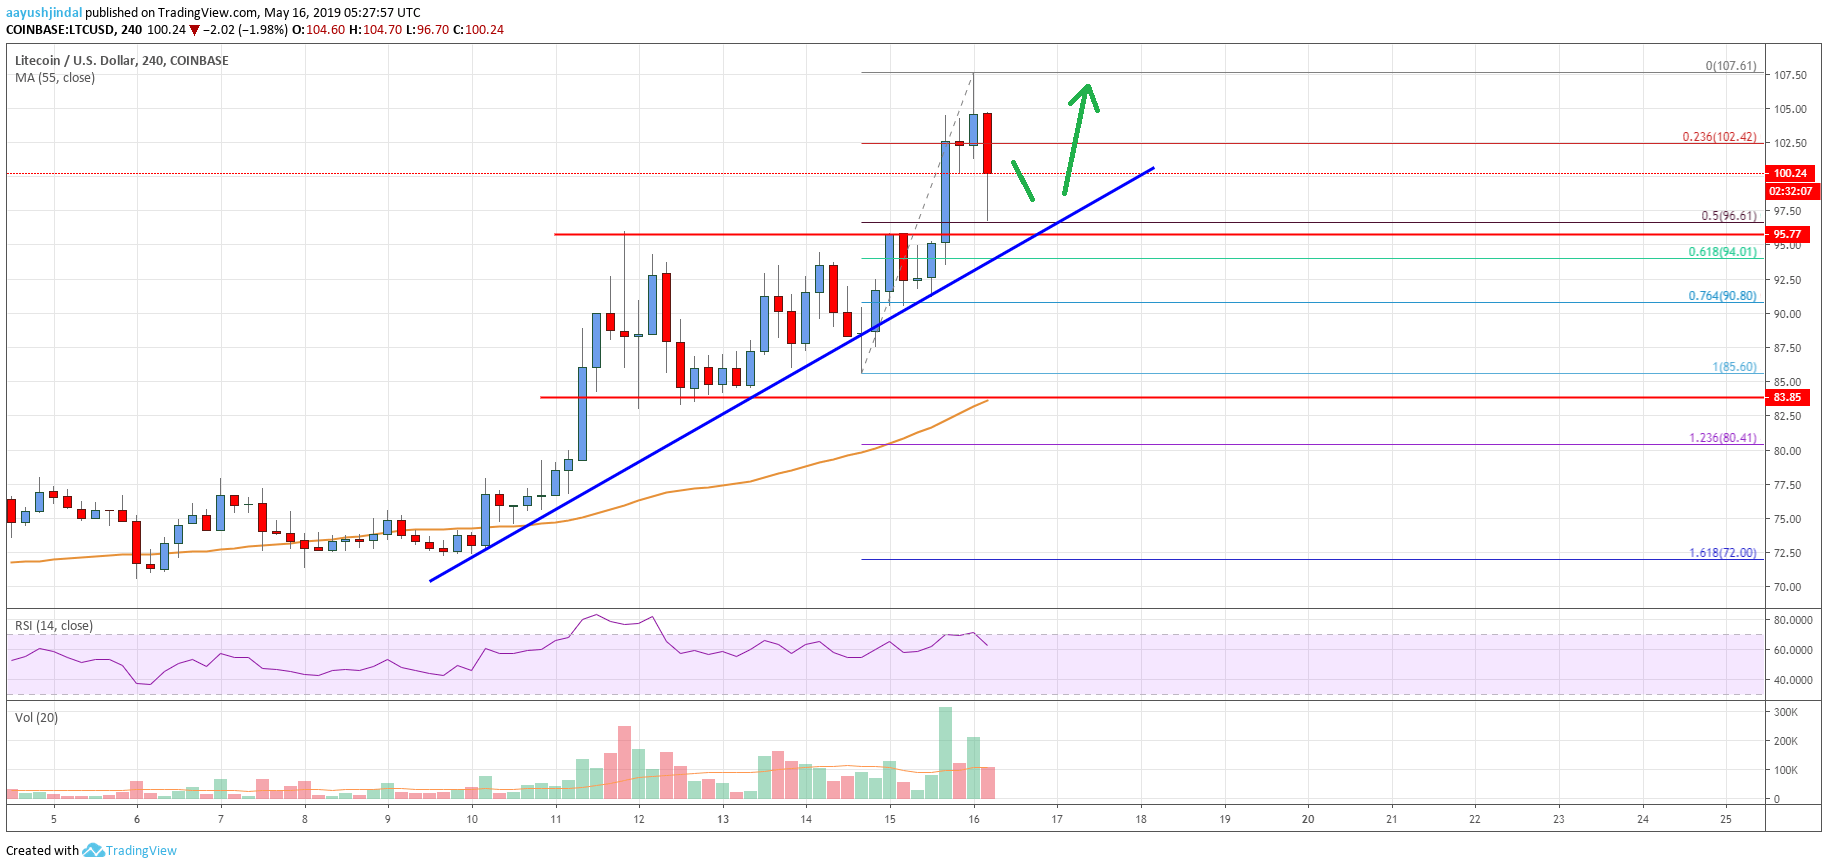
- There is a major bullish trend line forming with support at $96.20 on the 4-hours chart of the LTC/USD pair (data feed from Coinbase).
- The pair is currently correcting gains, but it remains well supported near $98.00 and $96.00.
Litecoin price rallied significantly and broke the $100.00 barrier against the US Dollar, while bitcoin is consolidating. LTC price is likely to continue higher and it could soon test $120.00.
Litecoin Price Analysis
This week, there was a strong rally in litecoin price from the $85.60 swing low against the US Dollar. The LTC/USD pair formed a support base above $82.00 and $85.00 and recently climbed significantly. Bitcoin and Ethereum also performed really well, helping LTC in clearing the main $90.00 and $92.00 resistance levels. The price even settled above the $90.00 barrier and the 55 simple moving average (4-hours). Finally, there was a break above the main $100.00 barrier. A new monthly high was formed at $107.61 and the price is currently correcting lower.
It broke the $102.00 support and the 23.6% Fib retracement level of the upward move from the $85.60 low to $107.61 high. The price even declined below the $100.00 level and recently tested the $96.00-98.00 support area. The 50% Fib retracement level of the upward move from the $85.60 low to $107.61 high is also near the $96.60 level to provide support. Moreover, there is a major bullish trend line forming with support at $96.20 on the 4-hours chart of the LTC/USD pair.
Therefore, the price remains well supported above the $96.00 and $98.00 levels. If there is a break below the trend line, the price could extend correction towards $90.80. It represents the 76.4% Fib retracement level of the upward move from the $85.60 low to $107.61 high. On the upside, an initial resistance is near the $102.50 level, above which the price may revisit the $107.00 level.

Looking at the chart, litecoin price is trading nicely in an uptrend above the $96.00 support area. If it starts a fresh increase above $102.50 and $107.00, there are chances of a break above $115.00. The next stop for the bulls could be near the $120.00 level in the near term.
Technical indicators
4 hours MACD – The MACD for LTC/USD is losing momentum in the bullish zone, with a few bearish signs.
4 hours RSI (Relative Strength Index) – The RSI for LTC/USD is currently moving lower towards the 60 level.
Key Support Levels – $98.00 and $96.00.
Key Resistance Levels – $107.00 and $115.00.


Leave a Reply
You must be logged in to post a comment.