- Litecoin price is showing positive above the $210 support level against the US Dollar.
- LTC price is now trading well above the $240 level and the 55 simple moving average (4-hours).
- There was a break above a key bearish trend line with resistance near $250 on the 4-hours chart of the LTC/USD pair (data feed from Coinbase).
- The pair is likely to continue higher if there is a clear break above $265.
Litecoin price is showing bullish signs above $240 against the US Dollar, similar to bitcoin. LTC price is likely to accelerate higher above the $265 resistance zone.
Litecoin Price Analysis
This week, there was a decent increase in bitcoin, Ethereum, ripple, and litecoin against the US Dollar. Earlier, LTC formed a support base above the $210 and $215 levels.
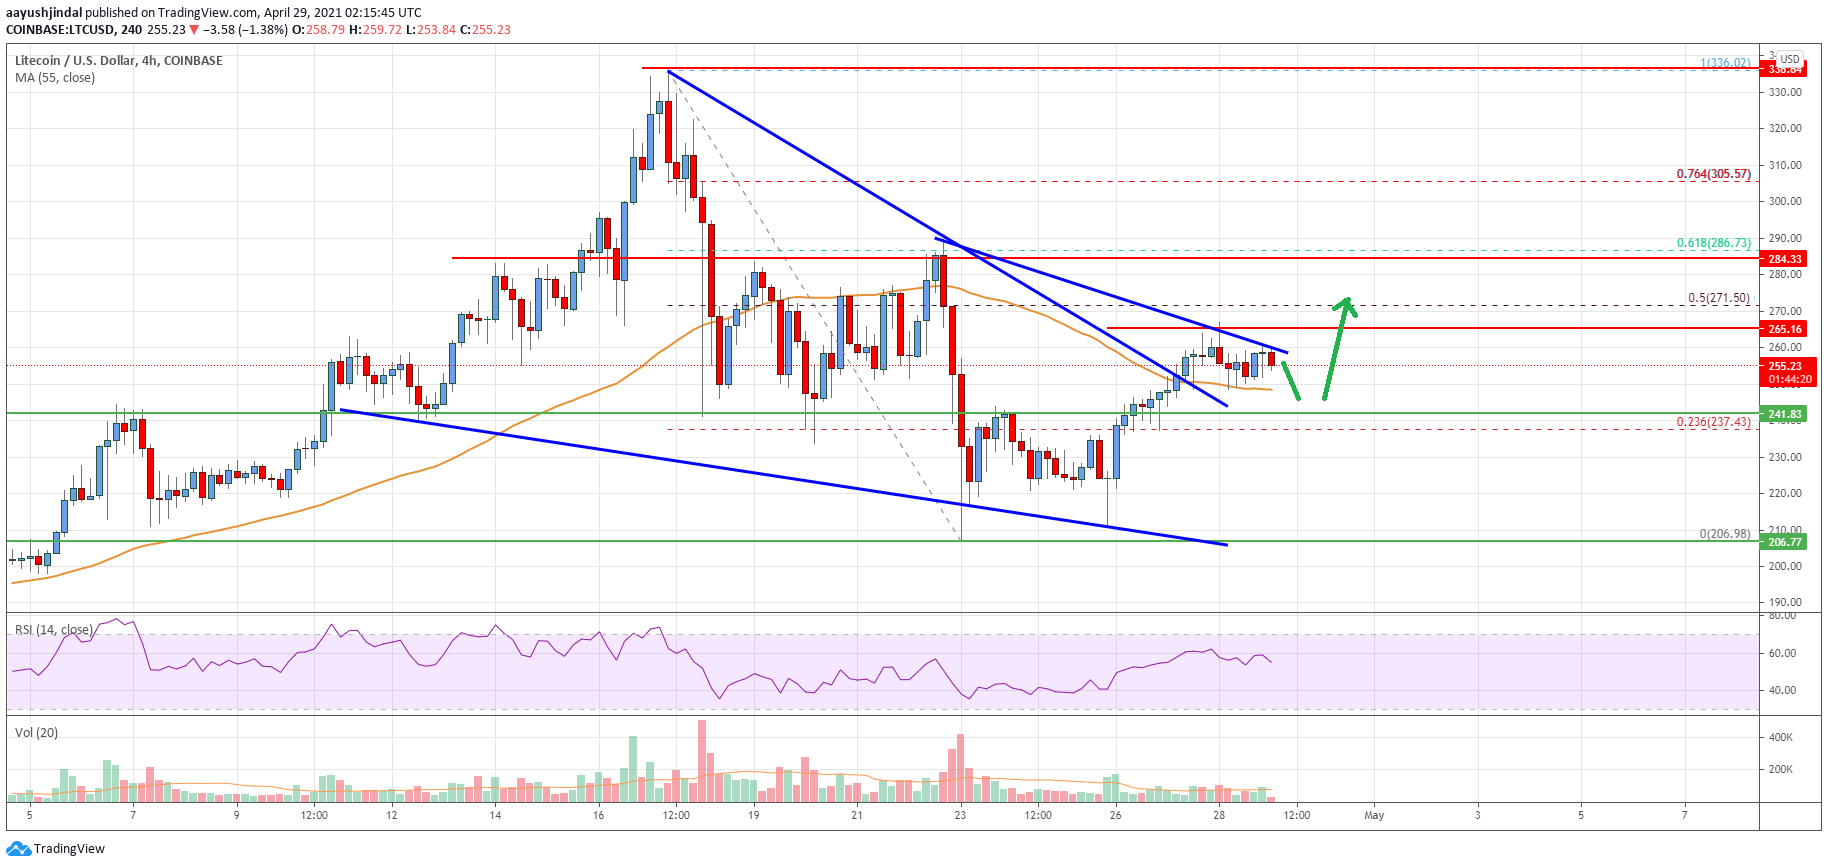
The bulls came into action and the price started a decent increase above the $220 and $230 levels. There was a break above the 23.6% Fib retracement level of the key decline from the $336 swing high to $206 low.
There was also a break above a key bearish trend line with resistance near $250 on the 4-hours chart of the LTC/USD pair. The pair gained pace above the $250 level. It is now trading well above the $240 level and the 55 simple moving average (4-hours).
The pair is now facing resistance is near the $260 level and a connecting bearish trend line. The next major resistance is near the $270 level.
The 50% Fib retracement level of the key decline from the $336 swing high to $206 low is also near the $270 level. A successful break above the $260 and $270 resistance levels. The next major resistance is near the $300 level, above which the price is likely to accelerate higher towards the $325 and $335 levels.
If there is a downside correction, the price is likely to find bids near the $250 level. If there is a downside break below the $250 level and the 55 simple moving average (4-hours), the price could accelerate lower towards the $240 support. Any more losses could lead the price towards the $220 support zone.

Looking at the chart, litecoin price is now trading nicely above $240 and the 55 simple moving average (4-hours). Overall, the price is likely to continue higher if there is a clear break above $265.
Technical indicators
4 hours MACD – The MACD for LTC/USD is slowly losing pace in the bullish zone.
4 hours RSI (Relative Strength Index) – The RSI for LTC/USD is still above the 50 level.
Key Support Levels – $240 and $220.
Key Resistance Levels – $260 and $270.


Leave a Reply
You must be logged in to post a comment.