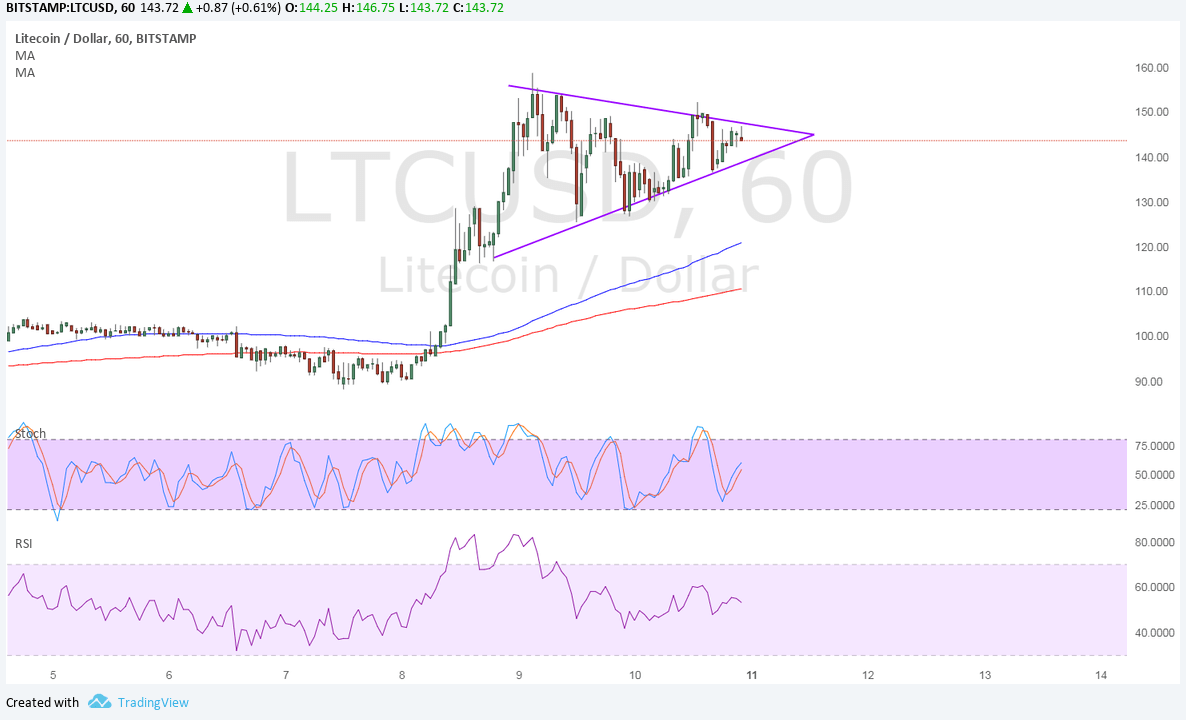
LTCUSD is currently consolidating inside a symmetrical triangle pattern, which can be seen as a bullish flag on longer-term charts. This is typically considered a classic continuation signal, so a break past the resistance around $145 could mean another leg higher.
The 100 SMA is above the longer-term 200 SMA so the path of least resistance is to the upside. In other words, the rally is more likely to resume than to reverse. The mast of the flag spans $90 to $160 so the resulting rally could be of the same height.
Stochastic is also pointing up to confirm that bullish momentum is in play. However, RSI is treading sideways to suggest that consolidation could carry on.

LTCUSD is being pulled in opposite directions as traders keep close tabs on the launch of bitcoin futures while also being vulnerable to dollar strength. The former is renewing interest in cryptocurrencies in general, allowing them to track bitcoin price gains. Meanwhile, the latter is due to stronger than expected jobs data released last Friday and expectations of a rate hike this week.
However, December hike expectations have been priced in for a long while already so there’s a strong chance of profit-taking happening during the FOMC announcement. Besides, traders are more curious about tightening chances next year and the updated economic forecasts should provide better clues.
Recall that the previous FOMC minutes signaled a weaker inflation outlook, which was also confirmed by Fed head Yellen. Should this be reflected in their projections, the dollar could lose ground to litecoin and spur an upside break from the flag.
On the other hand, optimistic estimates backed by a strong showing from CPI and retail sales figures due this week could still lead to more gains for the dollar. A downside break from LTCUSD consolidation could spur a larger pullback from the rally, possibly drawing support from the moving averages’ dynamic inflection points.


Leave a Reply
You must be logged in to post a comment.