
Repeated BTC drawdowns grow as price nears 200-week support while exchange balances keep falling.
Digital asset firm Matrixport believes that Bitcoin’s price trend may be entering a more fragile phase. As observed, the OG coin’s recent price swings resemble patterns seen at the start of past bear cycles. Although the asset remains strong in the long term, short-term momentum is deteriorating. And this has expectedly triggered the attention from of participants.
Bitcoin Shows Early Bear Signs, But 200-Week MA Offers Support
Matrixport points to Bitcoin’s 30-day rate of change as a key warning signal. Large 30-day declines exceeding 20% were rare during bull markets. When they occurred, buyers quickly stepped in and price recovered. In contrast, bear markets tend to feature repeated sharp contractions and weaker rebounds.
📊Today’s #Matrixport Daily Chart – February 16, 2026 ⬇️
More Bear Market Signals Are Emerging—But Opportunities Remain#Matrixport #Bitcoin #CryptoMarkets #BearMarket #RiskManagement #Volatility #MarketStructure #TradingStrategy #Liquidity pic.twitter.com/Bcx2SSOwt5
— Matrixport Official (@Matrixport_EN) February 16, 2026
According to recent data, momentum began fading around the middle of last year. Upside spikes in the 30-day rate of change have grown smaller over time. Each rally has shown less follow-through than the previous one.
Volatility has also clustered more often in negative territory. These trends indicate a decline in buying pressure relative to earlier in the cycle. Even at that, short-term moves alone cannot be used to confirm a full bear market.
The OG coin is now moving closer to its 200-week moving average. In the past, this level has acted as strong long-term support. During bear markets, staying far above this average often meant the market was overheated. And when price drew near, it usually signaled a reset in value, not a full collapse.
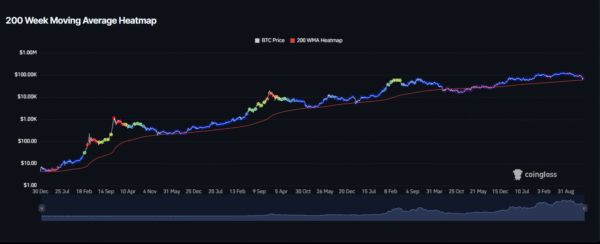
Image Source: CoinGlass
Even with the recent trend, analysts maintain that the exits are not a result of panic selling. In past cycles, strong price bottoms formed near or slightly below this level. As price moves closer again, long-term risk and reward start to look more balanced.
Falling Exchange Balances Support Bullish Long-Term Outlook
On-chain exchange data adds more context to Bitcoin’s recent price action. BTC balances on exchanges continue to decline. In early bear phases, exchange inflows usually rise as holders prepare to sell. Unfortunately, current flows do not show that kind of selling pressure.
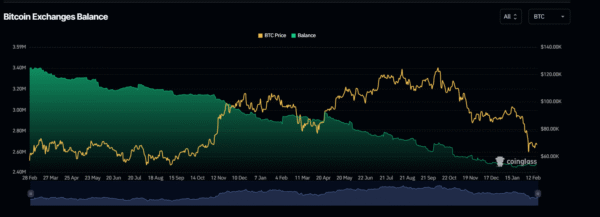
Image Source: CoinGlass
Meanwhile, coins continue to leave exchanges and move into cold storage or long-term wallets. Lower supply on trading platforms reduces immediate selling pressure. The absence of strong inflows also suggests that wide panic has not set in.
At the same time, coins held for 155 days or more continue to increase. Generally, growth in long-term holder supply during price declines often indicates that coins are moving from short-term traders to stronger hands.
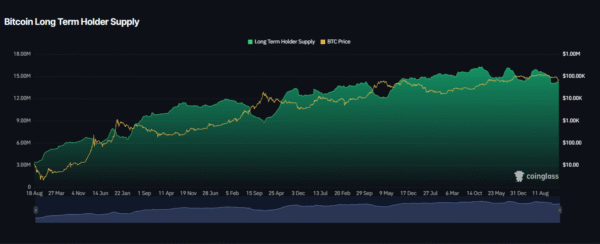
Image Source: CoinGlass
Likewise, past cycles showed similar patterns in the middle and later stages of bear markets. Weaker traders sold their positions, while patient investors quietly accumulated. Steady growth in long-term holder supply often came before major market bottoms. Such buying later supported a new upward cycle.
As per market commenters, the current setup suggests controlled deleveraging rather than broad distribution. Bear markets rarely move in a straight line. Sharp counter-trend rallies can still occur, especially when positioning becomes crowded.

