
- Solana trades 44.6% below its $156 fair value, with power-law models showing strong undervaluation.
- RSI at 28.25 signals oversold conditions, though bearish MACD confirms downtrend remains in effect.
- Model forecasts 51% return potential over one year, but wide confidence intervals reflect uncertainty.
Solana trades just around $87, representing a 44.6% discount to its calculated fair value of $156. Analyst Marty Party shared David Eng’s detailed valuation update, revealing a $70 gap between spot and model prices.
The power-law model assigns SOL a Z-score of -0.65, placing it in oversold territory. This analysis comes as the token faces sustained downward pressure across major exchanges.
Power-Law Model Shows Material Undervaluation
The valuation framework demonstrates a power-law fit with an R² of 0.6792. This means the long-term trend explains roughly 68% of historical price movements.
Solana Valuation – Feb 9 update by @david_eng_mba
* Spot price: $87
* Power-law fair value: $156
* Gap: -$70
* Discount to fair value: -44.6%
* Z-score: -0.65 (oversold)Model fit (R²) and robustness
* Power-law fit: R² = 0.6792
* Interpretation: the long-run trend… pic.twitter.com/sbZpbiu8rx
— MartyParty (@martypartymusic) February 9, 2026
However, the model reveals parameter instability, with rolling slopes ranging from -3.245 to 5.807 across different periods. Block bootstrap testing indicates robust directional signals despite data dependencies.
The mean-reversion half-life sits at 133 days under current conditions. Model projections suggest a drift path reaching approximately $135 within that timeframe.
At 266 days, the snap-back trajectory points toward $166. The maturity-adjusted forecast offers a 51% expected return over one year, though confidence intervals remain wide.
Solana Technical Analysis Confirms Oversold Territory
At press time, Solana trades at $84.48, down 2.64% on the daily chart. The price dropped sharply from $140 to its current levels with minimal consolidation.
Immediate support appears near $80, where recent wicks tested buyer strength. Resistance clusters around $100, marking previous consolidation zones.
The Relative Strength Index registers 28.25, well below the oversold threshold of 30. This reading suggests potential short-term buying interest could emerge.
The 14-day RSI moving average sits at 29.85, reinforcing the oversold condition. Strong selling pressure continues to dominate despite these technical signals.
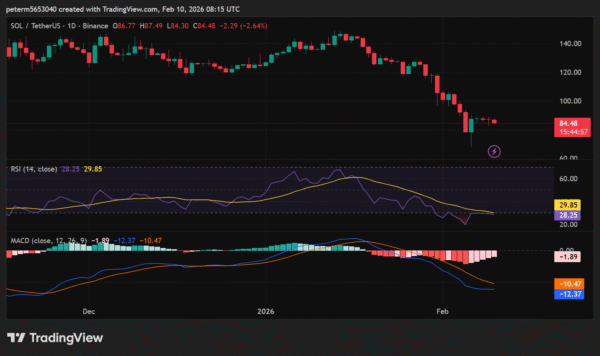
SOL MACD Signals Persistent Bearish Momentum
The MACD line rests at -12.37, positioned below the signal line at -10.47. This configuration confirms ongoing bearish momentum across the asset.
The histogram shows a slight increase toward zero at -1.89, hinting at slower selling pressure. Yet trend reversal requires a confirmed MACD crossover above the signal line.
Price action must break above $90 to $95 for meaningful bullish confirmation.
Key psychological levels include $75 as support and $120 as upper resistance. The overall trend remains bearish until technical indicators flip positive. Further declines become probable if support at $80 fails to hold.
Model Robustness and Forecast Limitations
The analysis incorporates rolling parameter stability tests and block bootstrap validation. Predictive correlation shows a mean of approximately -0.807 with a 95% confidence interval.
This suggests oversold conditions tend to precede outperformance in resampled scenarios. However, residual autocorrelation at 0.997 indicates highly persistent deviations from trend.
The maturity-adjusted forecast carries an R² of 0.8415, improving 31.2 percentage points over simpler models. Independent long-horizon samples remain limited to roughly four non-overlapping annual periods.
This constraint reduces magnitude precision even as directional signals appear strong. The 95% prediction interval spans from -66% to +574%, reflecting substantial uncertainty.
Hence, Eng’s analysis positions Solana materially below the trend with positive skew and high variance. Besides, the directional mean-reversion signal demonstrates reasonable robustness through dependent-data testing.
Point forecast magnitudes remain less reliable given limited sample depth and regime sensitivity.
