
- Ripple price started a decent recovery wave from the $0.2545 swing low against the US dollar.
- The price is currently trading above the $0.2700 and $0.2750 resistance levels.
- There was a break above a key bearish trend line with resistance near $0.2705 on the 4-hours chart of the XRP/USD pair (data source from Bittrex).
- The pair is likely to accelerate higher if it clears the $0.2920 and $0.3000 resistance levels.
Ripple price is slowly moving higher above $0.2800 against the US Dollar. XRP price could continue to rise if it manages to gain pace above $0.2920 and $0.2950.
Ripple Price Analysis
After a steady decline, ripple price found support near the $0.2550 level against the US Dollar. The XRP/USD pair traded as low as $0.2546 and recently started a decent recovery wave.
There was a break above the $0.2700 and $0.2720 resistance levels. The price gained pace above the 50% Fib retracement level of the downward move from the $0.2924 high to $0.2546 low. Ripple even settled above the $0.2750 level and the 55 simple moving average (4-hours).
More importantly, there was a break above a key bearish trend line with resistance near $0.2705 on the 4-hours chart of the XRP/USD pair. The pair is now testing the 76.4% Fib retracement level of the downward move from the $0.2924 high to $0.2546 low.
The first major resistance on the upside is near the $0.2920 level. The main breakout zone is near the $0.2980 and $0.3000 levels. A successful break above the $0.3000 barrier might open the doors for a strong increase towards the $0.3120 and $0.3200 levels in the near term.
Conversely, the price might start a downside correction from $0.2880 or $0.2920. An initial support on the downside is near the $0.2780 level and the 55 simple moving average (4-hours).
The main support is now forming near the $0.2740 level, below which the price is likely to restart its decline in the near term. The next major support could be $0.2640.
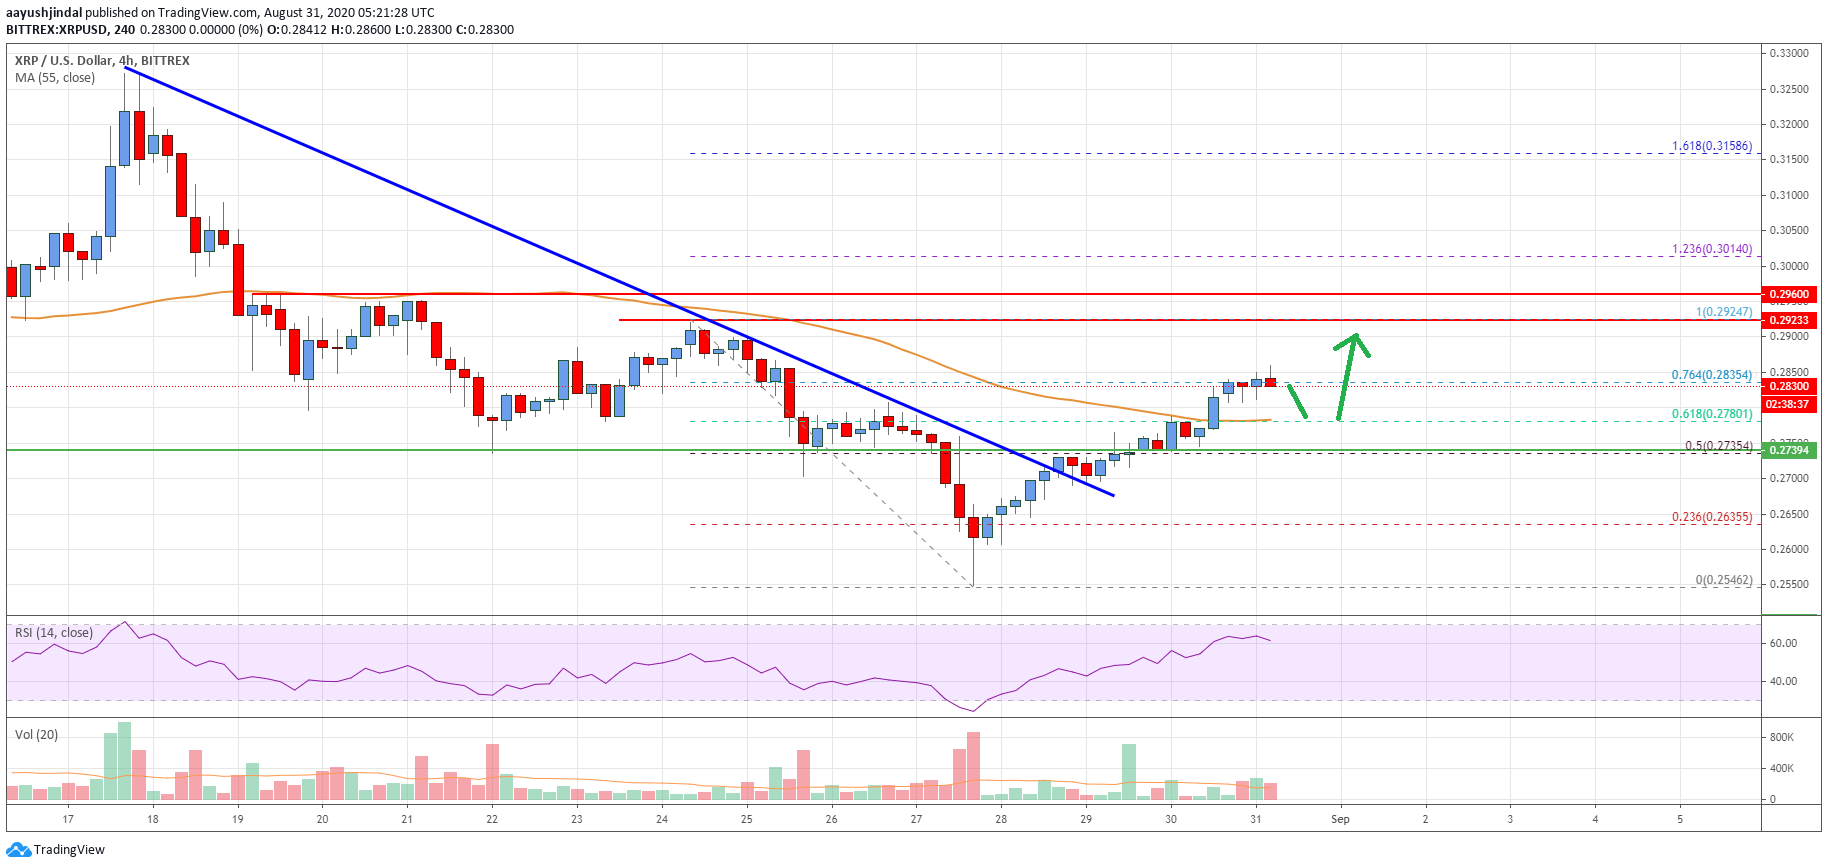
Looking at the chart, ripple price is clearly facing a couple of important hurdles near $0.2920. Therefore, the price is likely to accelerate higher if it clears the $0.2920 and $0.3000 resistance levels.
Technical indicators
4 hours MACD – The MACD for XRP/USD is slowly losing pace in the bullish zone.
4 hours RSI (Relative Strength Index) – The RSI for XRP/USD is currently above the 60 level.
Key Support Levels – $0.2780, $0.2740 and $0.2640.
Key Resistance Levels – $0.2920 and $0.3000.


Leave a Reply
You must be logged in to post a comment.