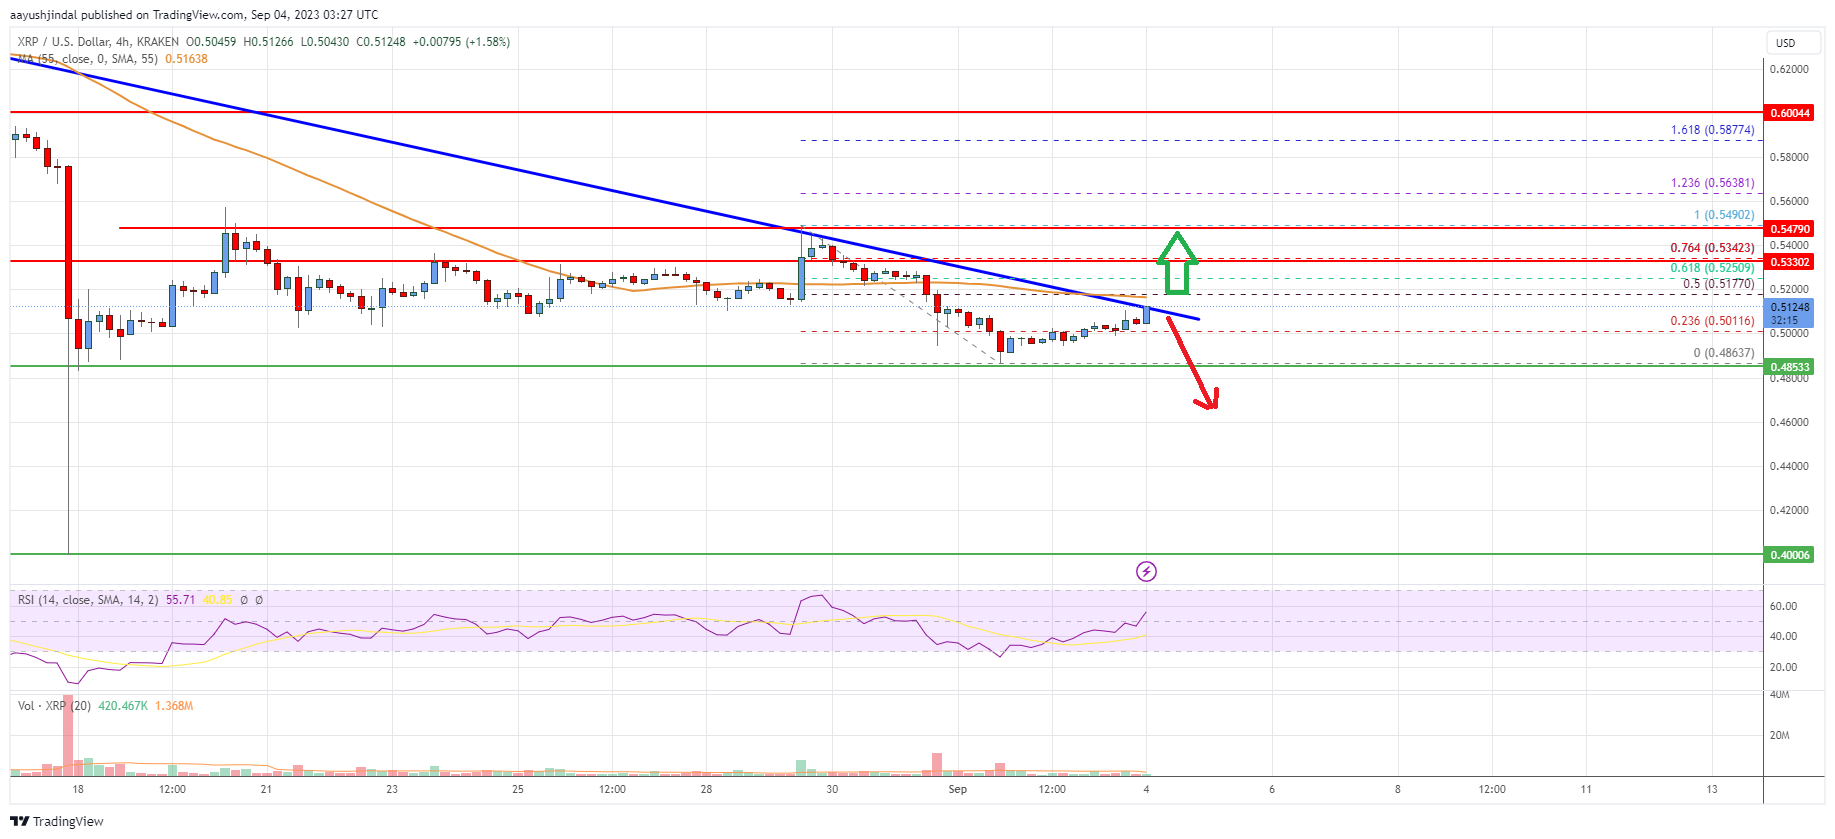
- Ripple price is facing resistance near the $0.550 level against the US dollar.
- The price is now trading below $0.520 and the 55 simple moving average (4 hours).
- There is a key bearish trend line forming with resistance near $0.5120 on the 4-hour chart of the XRP/USD pair (data source from Kraken).
- The pair could start another decline if it stays below $0.535 and $0.550.
Ripple price is struggling below $0.550 against the US Dollar, like Bitcoin. XRP price must stay above the $0.486 support to start a decent increase.
Ripple Price Analysis
After a fresh decline, Ripple price found support near the $0.486 zone against the US Dollar. The XRP/USD pair remained well-bid above $0.485 and recently started an upside correction.
A low was formed near $0.4863 before the pair started a recovery wave. There was a move above the $0.50 resistance zone. The price climbed above the 23.6% Fib retracement level of the downward move from the $0.5490 swing high to the $0.4863 low.
However, the price seems to be struggling to settle above the $0.520 resistance. There is also a key bearish trend line forming with resistance near $0.5120 on the 4-hour chart of the XRP/USD pair.
The price is now trading below $0.520 and the 55 simple moving average (4 hours). On the upside, the price is facing resistance near $0.512 and the trend line. The next major resistance is near the $0.518 level or the 50% Fib retracement level of the downward move from the $0.5490 swing high to the $0.4863 low or the 55 simple moving average (4 hours).
A clear move above the $0.518 and $0.520 levels might start a steady increase. In the stated case, the price could test the $0.550 resistance. Any more gains might send the price toward the $0.585 resistance.
Initial support on the downside is near the $0.500 level. The next major support is near the $0.486 level, below which the price could accelerate lower toward the $0.435 support. Any more losses could lead the price toward the $0.420 level.

Looking at the chart, Ripple price is now trading below the $0.520 zone and the 55 simple moving average (4 hours). Overall, the price could start another decline if it stays below $0.520 and $0.550.
Technical indicators
4 hours MACD – The MACD for XRP/USD is now gaining momentum in the bullish zone.
4 hours RSI (Relative Strength Index) – The RSI for XRP/USD is above the 50 level.
Key Support Levels – $0.500, $0.486, and $0.435.
Key Resistance Levels – $0.550 and $0.550.