- Ripple price started a downside correction from the $0.5500 zone against the US dollar.
- The price is now trading above $0.505 and the 55 simple moving average (4 hours).
- There is a key bullish trend line forming with support near $0.5090 on the 4-hour chart of the XRP/USD pair (data source from Kraken).
- The pair could start a fresh increase above the $0.5200 resistance.
Ripple price is consolidating near $0.510 against the US Dollar, similar to Bitcoin. XRP price must stay above the $0.500 support to remain in a bullish zone.
Ripple Price Analysis
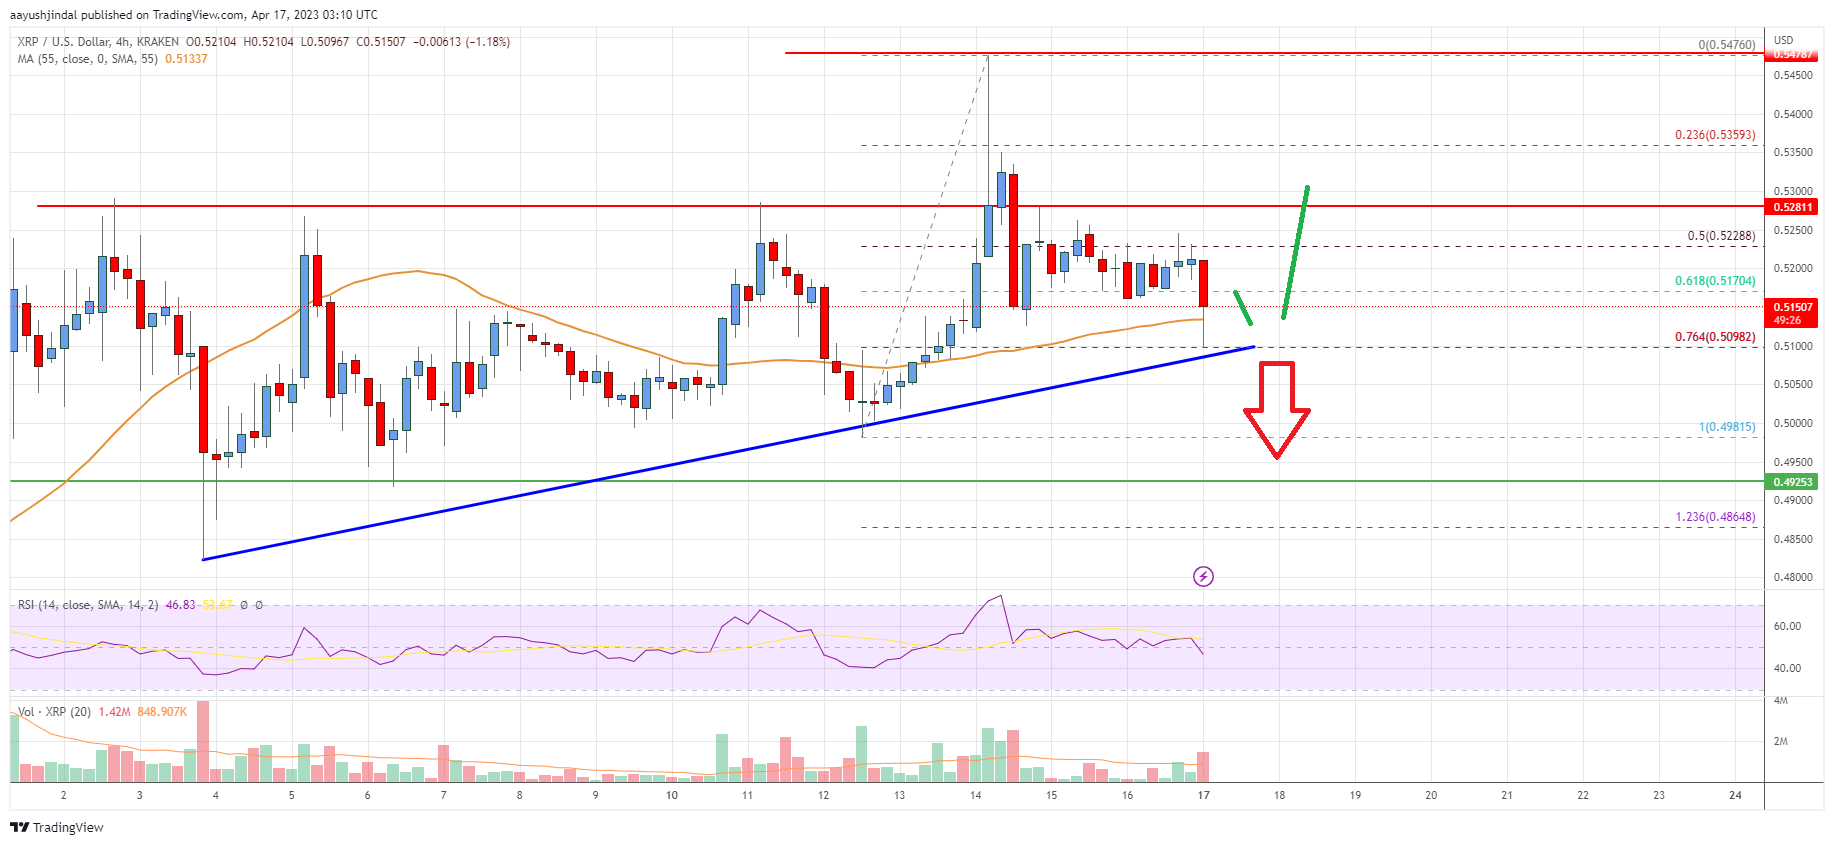
This past week, Ripple price saw a strong increase above the $0.5120 resistance against the US Dollar. The XRP/USD pair climbed above the $0.525 resistance to move into a positive zone.
There was a steady increase and the price climbed toward the $0.535 resistance. A high was formed near $0.5476 and the price recently corrected lower. There was a move below the $0.535 and $0.520 levels. The bears pushed the price below the 50% Fib retracement level of the upward move from the $0.4981 swing low to the $0.5476 high.
The price is now trading above $0.505 and the 55 simple moving average (4 hours). It is trading above the 76.4% Fib retracement level of the upward move from the $0.4981 swing low to the $0.5476 high.
There is also a key bullish trend line forming with support near $0.5090 on the 4-hour chart of the XRP/USD pair. On the upside, the price is facing resistance near $0.5200.
The next major resistance is near the $0.5280 level. A close above the $0.5280 resistance zone might start a strong increase. In the stated case, the price could even surpass the $0.5500 resistance. Any more gains might send the price toward the $0.580 resistance.
Initial support on the downside is near the $0.5090 level. The next major support is near the $0.5000 level. Any more losses could lead the price toward the $0.492 level, below which the price might even test $0.465.

Looking at the chart, Ripple’s price is now trading above the $0.505 zone and the 55 simple moving average (4 hours). Overall, the price could start a major increase above the $0.5200 resistance.
Technical indicators
4 hours MACD – The MACD for XRP/USD is now gaining momentum in the bearish zone.
4 hours RSI (Relative Strength Index) – The RSI for XRP/USD is near the 50 level.
Key Support Levels – $0.5090, $0.5000, and $0.492.
Key Resistance Levels – $0.5200 and $0.5280.


Leave a Reply
You must be logged in to post a comment.