
- Ripple price started a fresh increase above the $0.82 resistance zone against the US dollar.
- The price is now trading above $0.82 and the 55 simple moving average (4-hours).
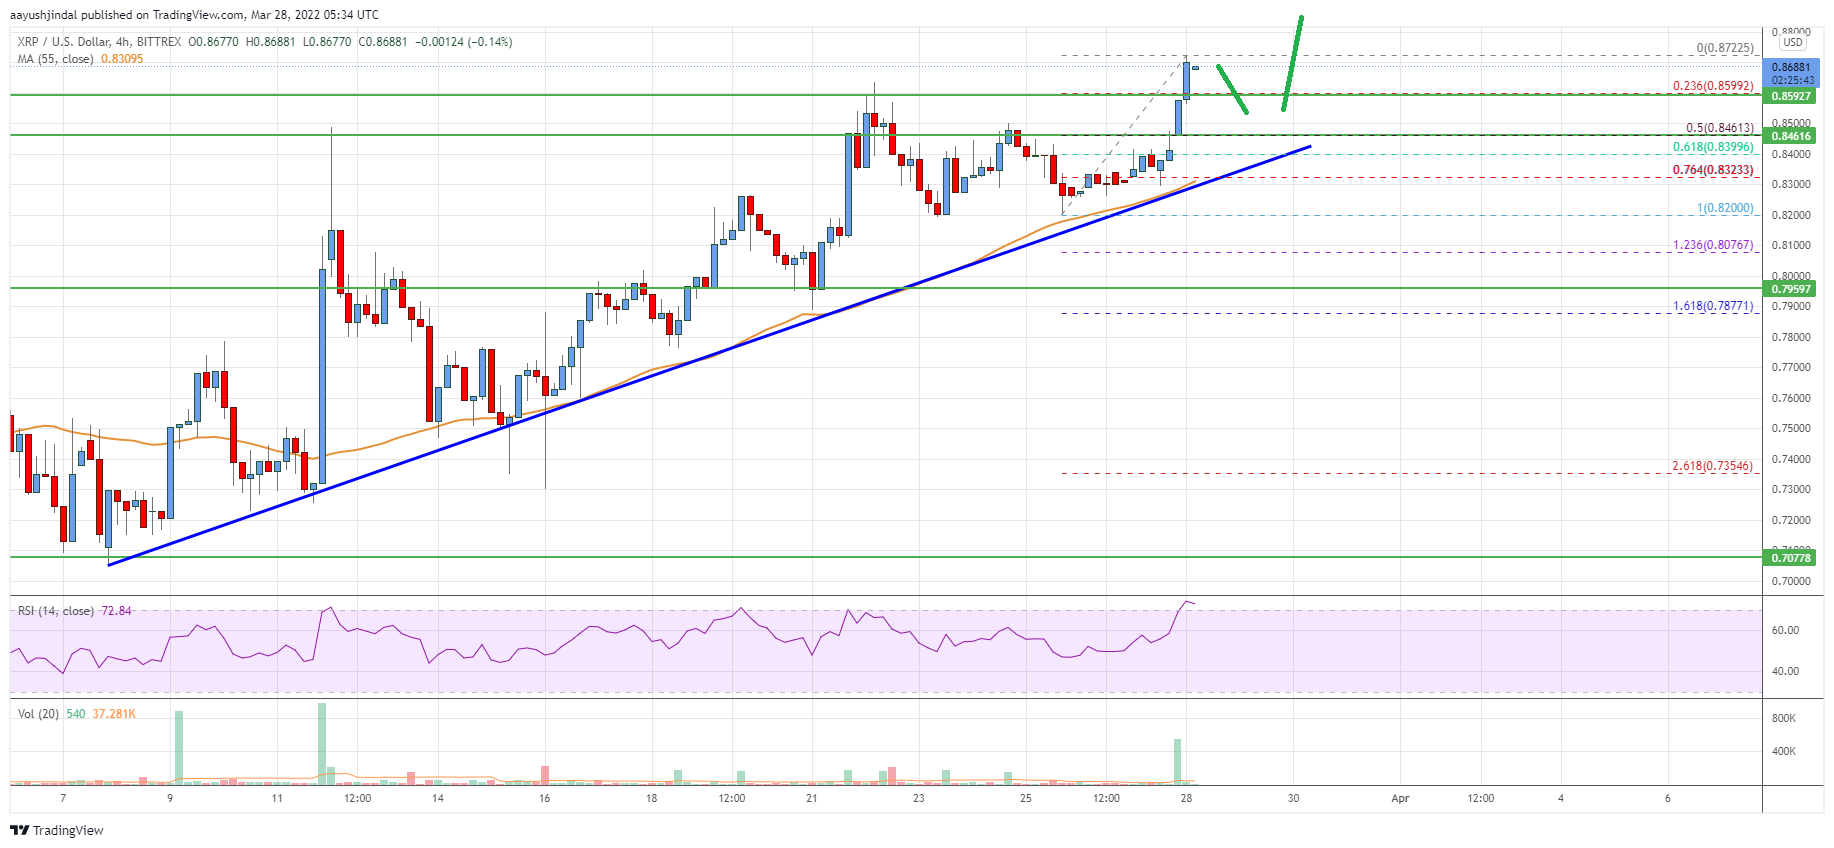
- There is a key bullish trend line forming with support near $0.8380 on the 4-hours chart of the XRP/USD pair (data source from Bittrex).
- The pair could start another increase if it manages to clear the $0.9000 resistance zone.
Ripple price is trading in a bullish zone above $0.8200 against the US Dollar, unlike bitcoin. XRP price must clear $0.9000 to continue higher in the near term.
Ripple Price Analysis
In the past few sessions, ripple price saw a decent increase above the $0.8000 resistance zone against the US Dollar. The XRP/USD pair broke the $0.8200 zone to enter a positive zone.
There was a clear move above the $0.8500 zone and a close above the 55 simple moving average (4-hours). The price even surpassed the $0.8650 level and traded as high as $0.8722. It is now consolidating gains below $0.8720. An initial support is near the $0.8600 level.
It is near the 23.6% Fib retracement level of the upward move from the $0.8200 swing low to $0.8722 high. The next major support is near the $0.8460 level.
The 50% Fib retracement level of the upward move from the $0.8200 swing low to $0.8722 high is also near the 0.8460 level. Besides, there is a key bullish trend line forming with support near $0.8380 on the 4-hours chart of the XRP/USD pair.
The main support is near the $0.8200 zone and the 55 simple moving average (4-hours). Any more losses could lead the price towards the $0.8000 level in the near term, below which the price might even test $0.7500.
On the upside, the price is facing resistance near the $0.8750 zone. The next key resistance is near the $0.9000 level. Any more gains could lead the price towards the $0.9550 level.
Looking at the chart, ripple price is now trading above $0.8200 and the 55 simple moving average (4-hours). Overall, the price could start another increase if it manages to clear the $0.9000 resistance zone.
Technical indicators
4 hours MACD – The MACD for XRP/USD is now gaining momentum in the bullish zone.
4 hours RSI (Relative Strength Index) – The RSI for XRP/USD is above the 50 level.
Key Support Levels – $0.8600, $0.8450 and $0.8200.
Key Resistance Levels – $0.8750 and $0.9000.


Leave a Reply
You must be logged in to post a comment.