- Ripple price gained traction and it rallied above $1.00 against the US dollar.
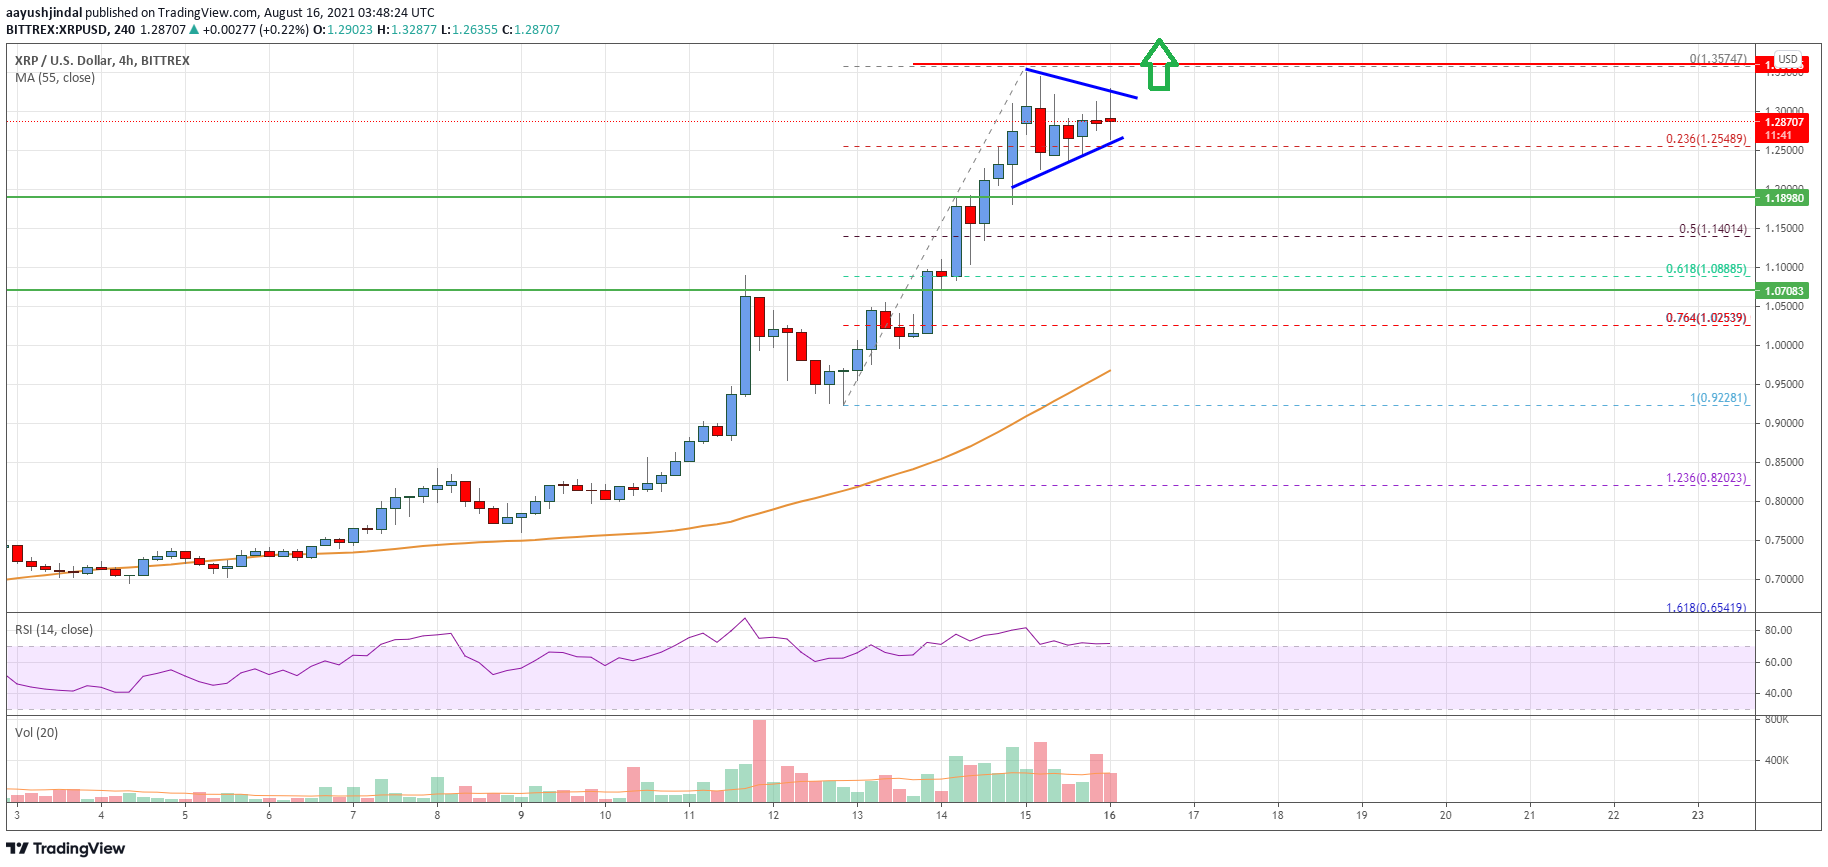
- The price is now trading well above the $1.10 resistance and the 55 simple moving average (4-hours).
- There is a key contracting triangle forming with resistance near $1.32 on the 4-hours chart of the XRP/USD pair (data source from Bittrex).
- The pair could continue to rise as long as it is above the $1.10 support zone.
Ripple price is trading in a positive zone above $1.10 against the US Dollar, similar to bitcoin. XRP price could accelerate further higher if it clears the $1.35 hurdle.
Ripple Price Analysis
Recently, there was a fresh increase in ripple price above the $0.8500 resistance against the US Dollar. The XRP/USD pair broke the key $1.00 resistance zone to move further into a bullish zone.
The price is now trading well above the $1.10 resistance and the 55 simple moving average (4-hours). It even broke the $1.25 level and traded as high as $1.357. It is now consolidating gains and trading below the $1.30 support level.
It spiked below the 23.6% Fib retracement level of the upward move from the $0.9228 swing low to $1.357 high. It is now consolidating above the $1.250 support.
There is also a key contracting triangle forming with resistance near $1.32 on the 4-hours chart of the XRP/USD pair. On the upside, an initial resistance is near the $1.31 level. The next major resistance is near the $1.35 level. To start a fresh rally, the price must clear the $1.35 resistance.
In the stated case, the price could rise towards the $1.50 level. On the downside, the bulls are likely to remain active near the $1.25 level.
The next major support is near the $1.18 level. Any more losses could lead the price towards the 1.15 level. It is close to the 50% Fib retracement level of the upward move from the $0.9228 swing low to $1.357 high.
Looking at the chart, ripple price is now trading well above the $1.10 resistance and the 55 simple moving average (4-hours). Overall, the price could continue to rise as long as it is above the $1.10 support zone.
Technical indicators
4 hours MACD – The MACD for XRP/USD is now losing momentum in the bullish zone.
4 hours RSI (Relative Strength Index) – The RSI for XRP/USD is still above the 55 level.
Key Support Levels – $1.25, $1.18 and $1.15.
Key Resistance Levels – $1.32 and $1.35.


Leave a Reply
You must be logged in to post a comment.