- Ripple price failed to extend gains above the $0.5800 resistance level against the US dollar.
- The price is now trading well below the $0.5500 zone and the 55 simple moving average (4-hours).
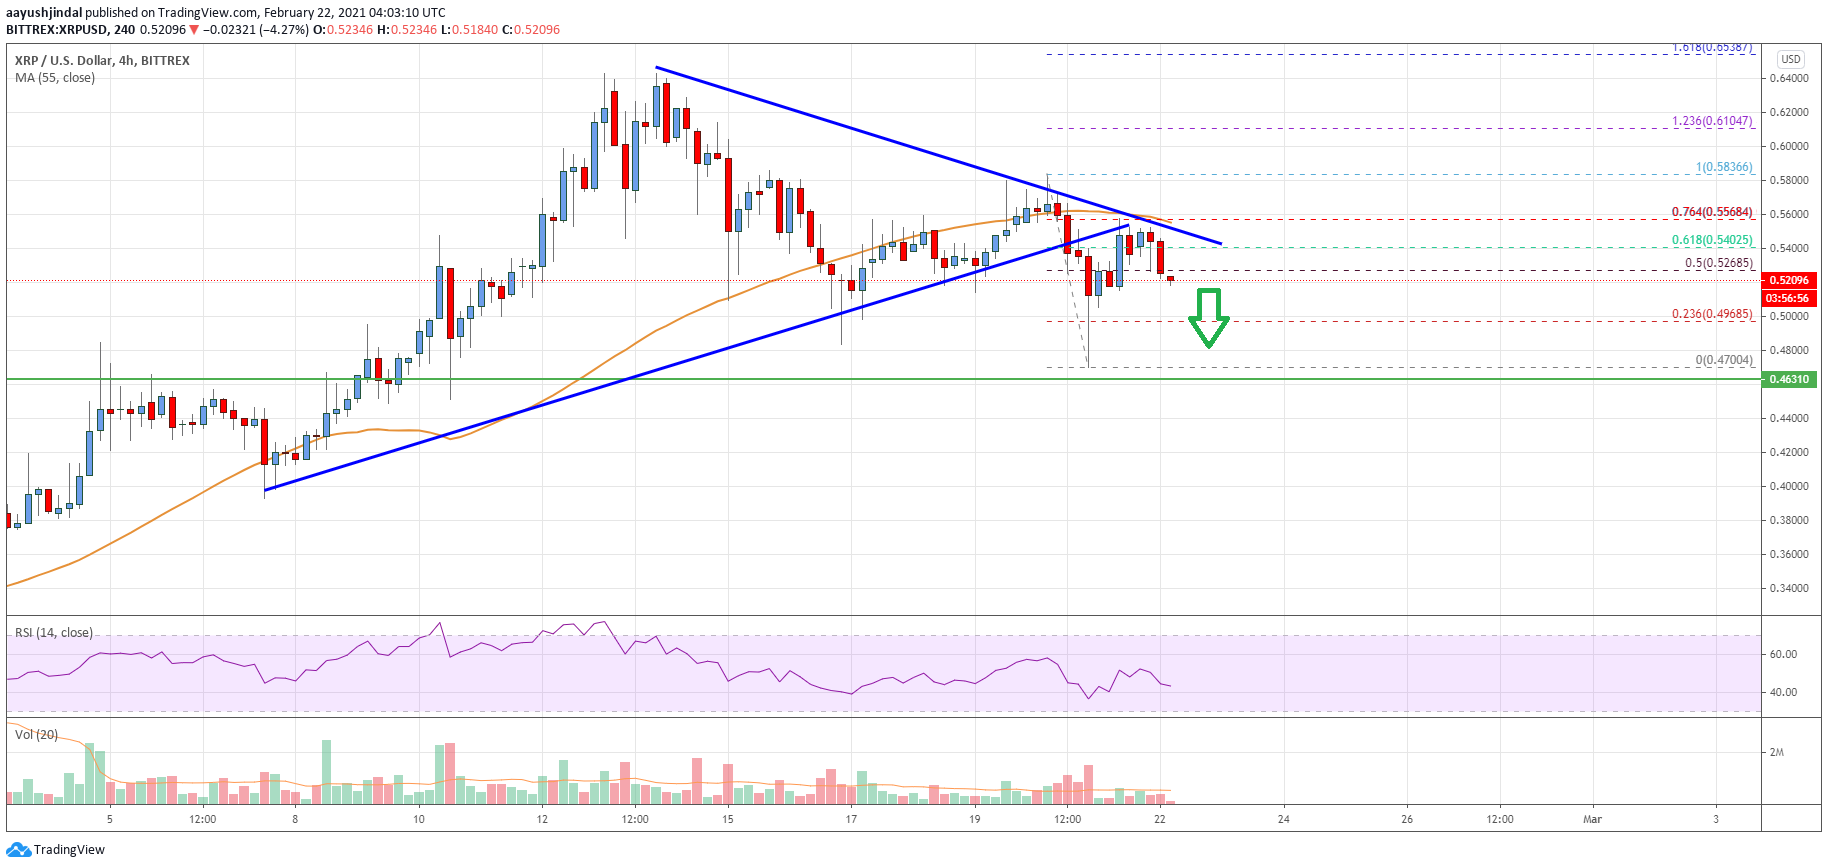
- There is a key bearish trend line forming with resistance near $0.5550 on the 4-hours chart of the XRP/USD pair (data source from Bittrex).
- The pair is likely to continue lower towards the main $0.4650 support zone in the near term.
Ripple price is struggling to settle above $0.5200 against the US Dollar. XRP price is correcting gains, but the bulls are likely to remain active near $0.4650.
Ripple Price Analysis
After an upside break above the $0.5500 resistance, ripple price faced a strong resistance against the US Dollar. The XRP/USD pair topped near the $0.5835 level and recently started a fresh decline.
There was a break below the $0.5500 support level and the 55 simple moving average (4-hours). There was also a break below a connecting bullish trend line with support near $0.5450 on the 4-hours chart of the XRP/USD pair.
The pair traded as low as $0.4700 and recently started an upside correction. It broke the 50% Fib retracement level of the downward move from the $0.5836 high to $0.4700 low. However, the price seems to be facing a strong resistance near the $0.5500 zone and the 55 simple moving average (4-hours).
There is also a key bearish trend line forming with resistance near $0.5550 on the same chart. XRP also failed to clear the 76.4% Fib retracement level of the downward move from the $0.5836 high to $0.4700 low.
It is now showing a lot of positive signs and trading well below $0.5320. An initial support on the downside is near the $0.5050 level. The first major support sits near the $0.5000 level. The main support is near the $0.4650 level, below which there is a risk of a sharp decline in the coming sessions.
On the upside, the main major resistance is near the $0.5500 level. A clear break above the $0.5500 resistance may possibly start a fresh increase above the $0.5800 level.

Looking at the chart, ripple price is clearly trading well below the $0.5500 zone and the 55 simple moving average (4-hours). Overall, the price is likely to continue lower towards the main $0.4650 support zone in the near term.
Technical indicators
4 hours MACD – The MACD for XRP/USD is slowly gaining momentum in the bearish zone.
4 hours RSI (Relative Strength Index) – The RSI for XRP/USD is now below the 50 level.
Key Support Levels – $0.5050, $0.5000 and $0.4650.
Key Resistance Levels – $0.5500 and $0.5850.


Leave a Reply
You must be logged in to post a comment.