
- Ripple price failed to clear $0.3700 and started a strong decline below $0.3000 against the US dollar.
- The price is now holding the key $0.2550 support level and the 55 simple moving average (4-hours).
- There is a major bullish trend line forming with support near $0.2560 on the 4-hours chart of the XRP/USD pair (data source from Bittrex).
- The pair could start a strong recovery wave as long as the price above $0.2550 and $0.2560.
Ripple price is down over 20% from well above $0.3500 against the US Dollar. XRP price is now testing the key $0.2550 support, where the bulls are likely to take a stand.
Ripple Price Analysis
There was a strong recovery wave above $0.3000 in ripple price against the US Dollar. The XRP/USD pair broke many important hurdles near $0.3220 and $0.3350 to move into a positive zone.
There was also a close above the $0.3220 level and the 55 simple moving average (4-hours). The price even broke $0.3500, but it failed to continue higher above $0.3700. There were two attempts by the bulls to clear $0.3700, but they failed.
As a result, there was a bearish reaction below the $0.3200 and $0.3000 support levels. The bears took control and the price even declined below the $0.2800 support.
However, the bulls were active near the $0.2550 support zone and the 55 simple moving average (4-hours). There is also a major bullish trend line forming with support near $0.2560 on the 4-hours chart of the XRP/USD pair. A low is formed near 0.2559 and the price is currently consolidating losses. An initial resistance is near the $0.2820.
It is close to the 23.6% Fib retracement level of the recent decline from the $0.3671 swing high to $0.2559 low. The next major resistance on the upside is near the $0.3000 and $0.3120 levels.
The 50% Fib retracement level of the recent decline from the $0.3671 swing high to $0.2559 low is also near $0.3100 to act as a hurdle. A close above $0.3100 could open the doors for a fresh increase. Conversely, the price might break the key $0.2550 support.
A close below the $0.2550 support and the 55 simple moving average (4-hours) could accelerate the current decline. The next major support on the downside is near the $0.2200 level.
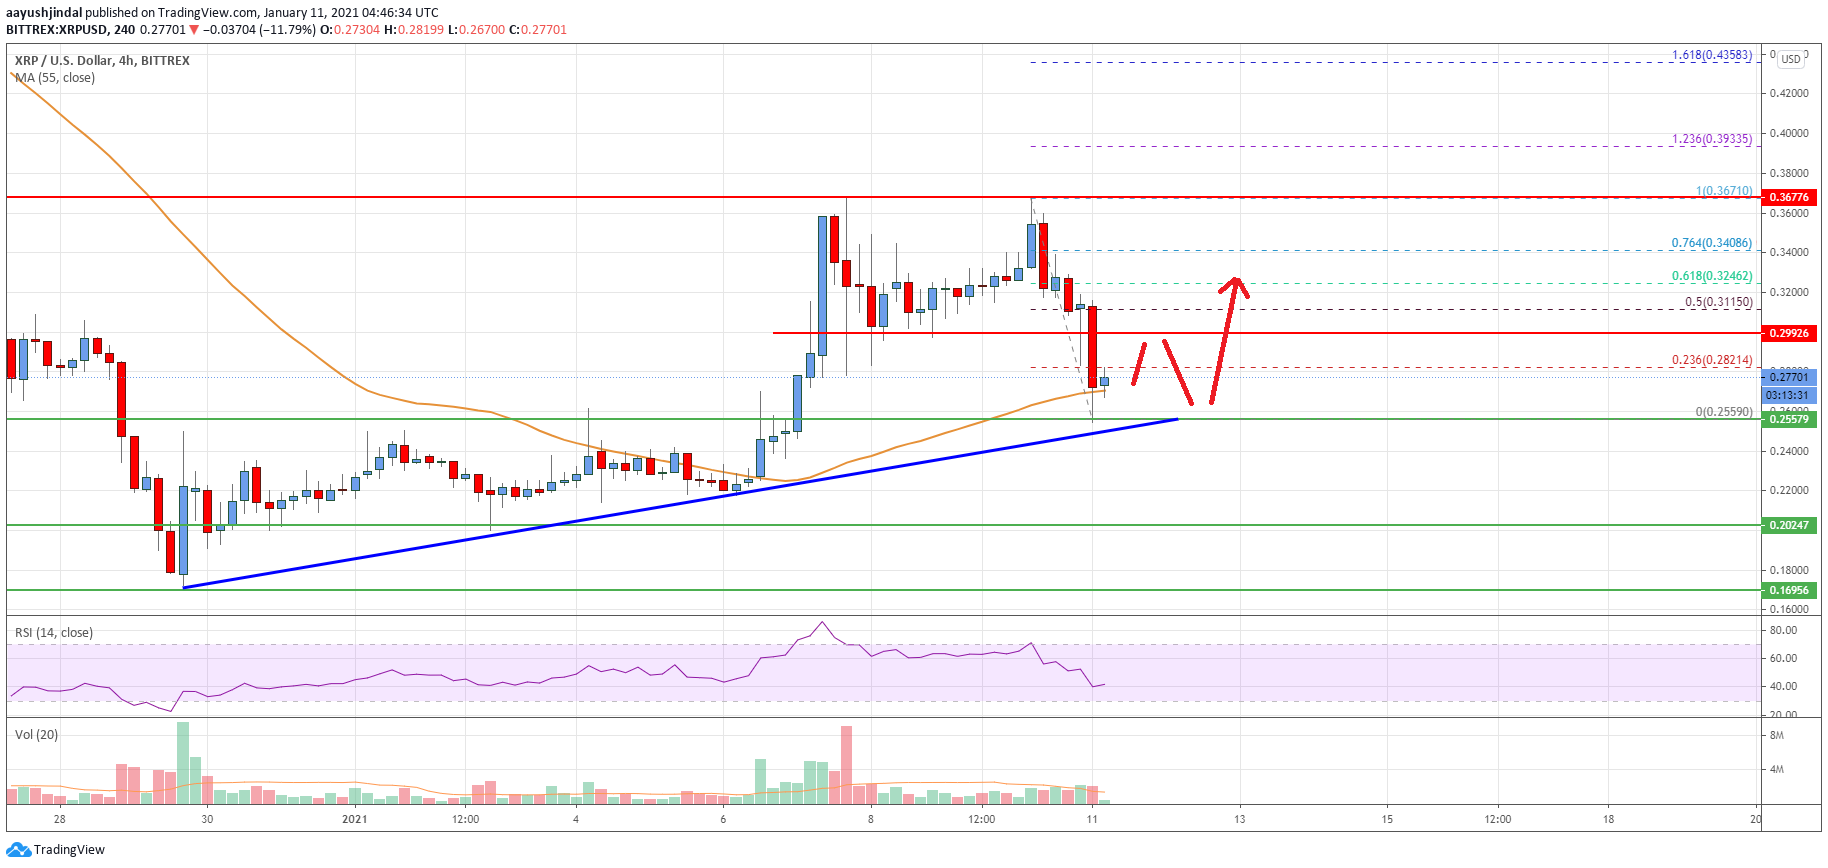
Looking at the chart, ripple price is clearly trading above a major support at $0.2550 and the 55 simple moving average (4-hours). Overall, the price could start a strong recovery wave as long as the price above $0.2550 and $0.2560.
Technical indicators
4 hours MACD – The MACD for XRP/USD is currently gaining momentum in the bearish zone.
4 hours RSI (Relative Strength Index) – The RSI for XRP/USD is now well below the 50 level.
Key Support Levels – $0.2560, $0.2550 and $0.2200.
Key Resistance Levels – $0.3000 and $0.3120.


Leave a Reply
You must be logged in to post a comment.