Key Highlights
- Ripple price after trading down and completing a correction phase started to move back up.
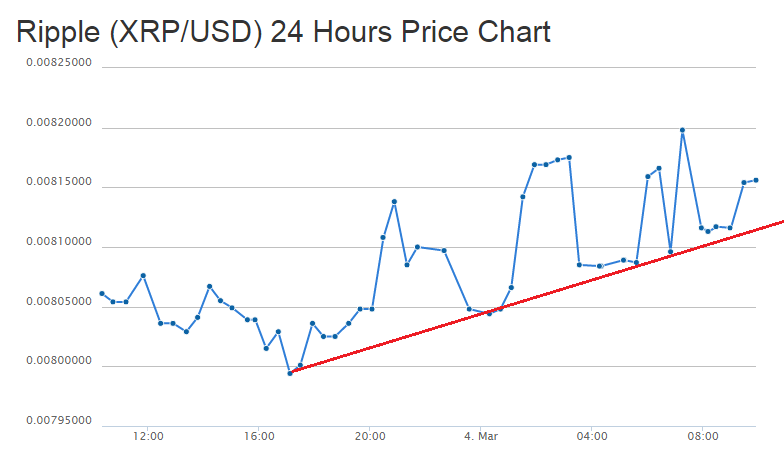
- There is a bullish trend line formed on the hourly chart of Ripple price (provided as CoinGecko), which is acting as a reason for the current trend.
- The price already tested $0.00820 once and it looks like heading towards it once again.
Ripple price started to move back higher after a minor correction and may continue to head higher.
Ripple Price – Buying?
Ripple price corrected a few more points yesterday as forecasted, and found support near the $0.008000 level. The price bounced back and traded higher. The price traded as high as $0.008198 and almost tested our target of $0.008200. Now, there is a bullish trend line formed on the hourly chart of Ripple price (provided as CoinGecko), which is serving as a support for the price.
On the downside, the trend line support is aligned with the 23.6% Fib retracement level of the last leg from the $0.007994 low to $0.008198 high. So, the bulls may take a stand if the price moves down from the current levels. A break below the trend line and support area may call for a change in the trend from bullish to bearish in the short term. The next support in that case may be around the 50% Fib retracement level of the last leg from the $0.007994 low to $0.008198 high.
On the upside, if buyers gain control further, then a break above the last high of $0.008198 could easily take the price towards the $0.008250 area where sellers may take a stand.
Looking at the indicators:
Hourly MACD – The MACD is back in the bullish zone, suggesting for more gains
Hourly RSI – The RSI is also above the 50 level, which is a positive sign for the bulls.
Intraday Support Level – $0.008110
Intraday Resistance Level – $0.008200
Charts Courtesy: Coingecko
