Key Highlights
- Litecoin price is just behaving and trading like Bitcoin price, as after moving down it is consolidating.
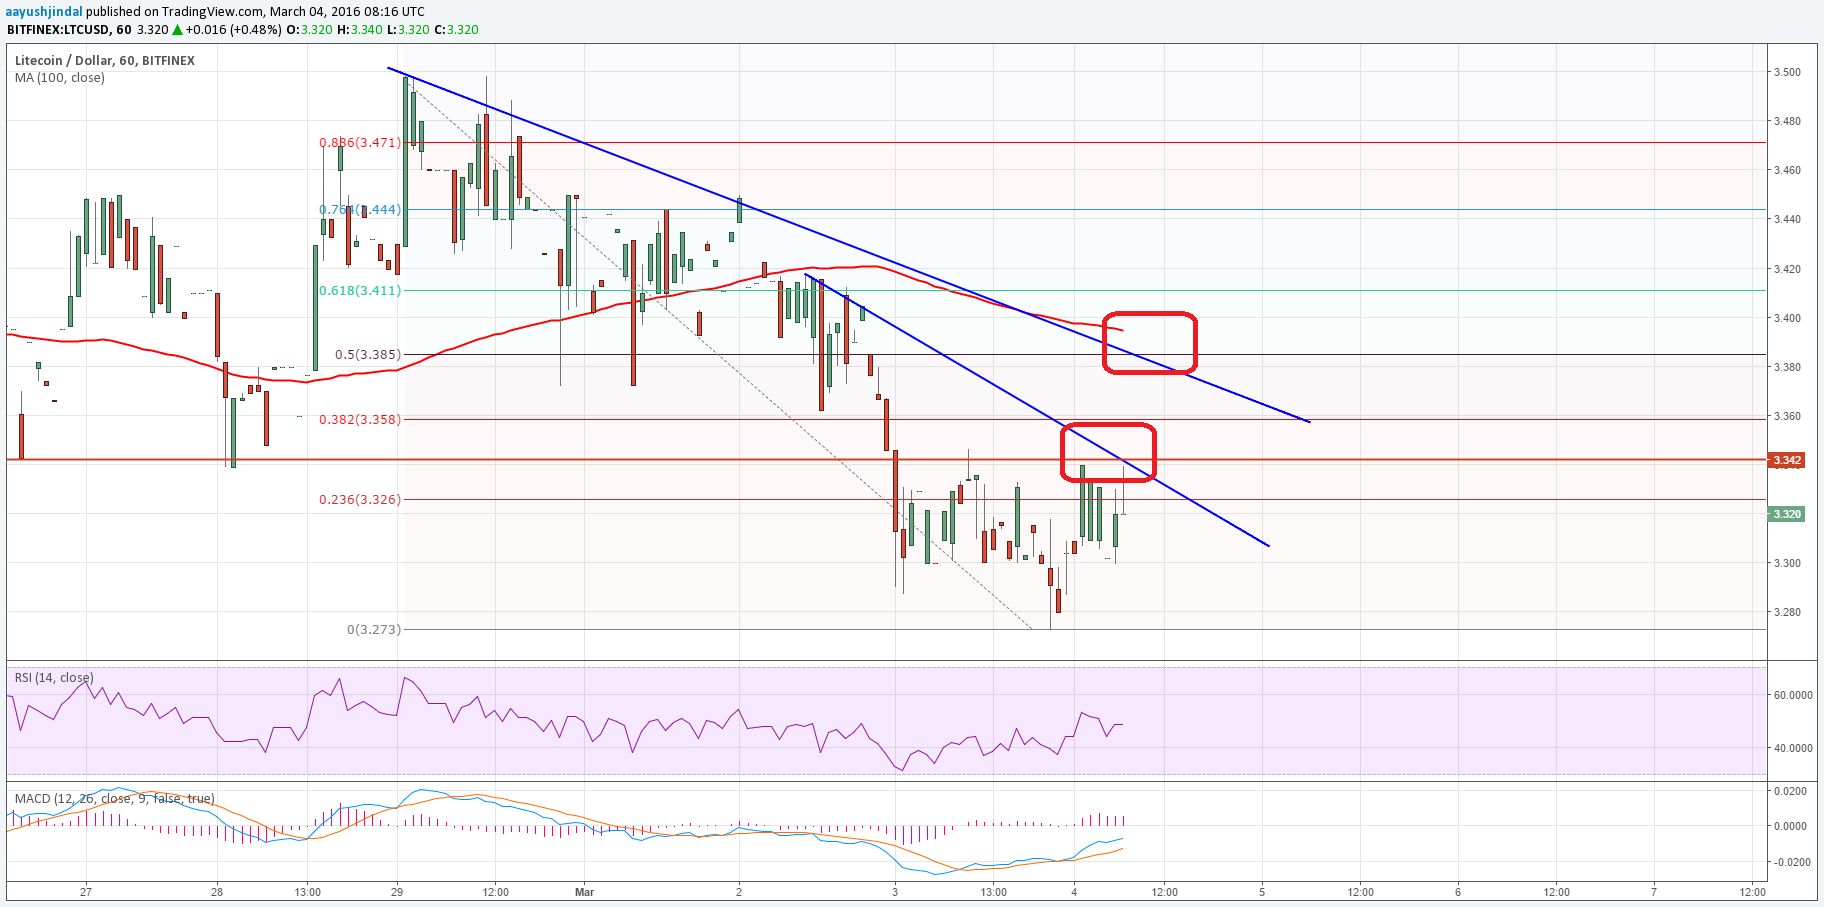
- There are a couple of trend lines formed on the hourly chart with data feed from Bitfinex.
- If the price moves higher from the current levels, then it may face selling pressure around $3.35-40.
Litecoin price is consolidating in a range and may move higher, but as long as it is below $3.40 sellers may remain in control.
Sell Near Trend Line?
After a decline in Litecoin price, the price stabilized around $3.27 and showing signs of a consolidation pattern. The price already corrected a few points higher, and currently trading near the 23.6% Fib retracement level of the last drop from the $3.49 high to $3.27 low. There is a bearish trend line on the hourly chart with data feed from Bitfinex, which is acting as a hurdle for the bulls and preventing an upside move.
If there is a break above the first bearish trend line, then there is a chance of the price moving towards the second bearish trend line on the same chart. Moreover, traders must also keep an eye on the 50% Fib retracement level of the last drop from the $3.49 high to $3.27 low. The 100 hourly simple moving average is also on the upside waiting patiently to act as a barrier for more gains if the price moves higher.
On the downside, the $3.30-25 levels holds a lot of importance for the price. A break below it may call for more losses that could take it towards $3.10.
Looking at the indicators:
Hourly MACD – The MACD is in the bullish zone, which is a short-term positive sign.
Hourly RSI – The RSI is below the 50 level, which may be a concern for the buyers.
Intraday Support Level (HitBTC) – $3.27
Intraday Resistance Level (HitBTC) – $3.38
Charts from Bitfinex; hosted by Trading View
