Key Points
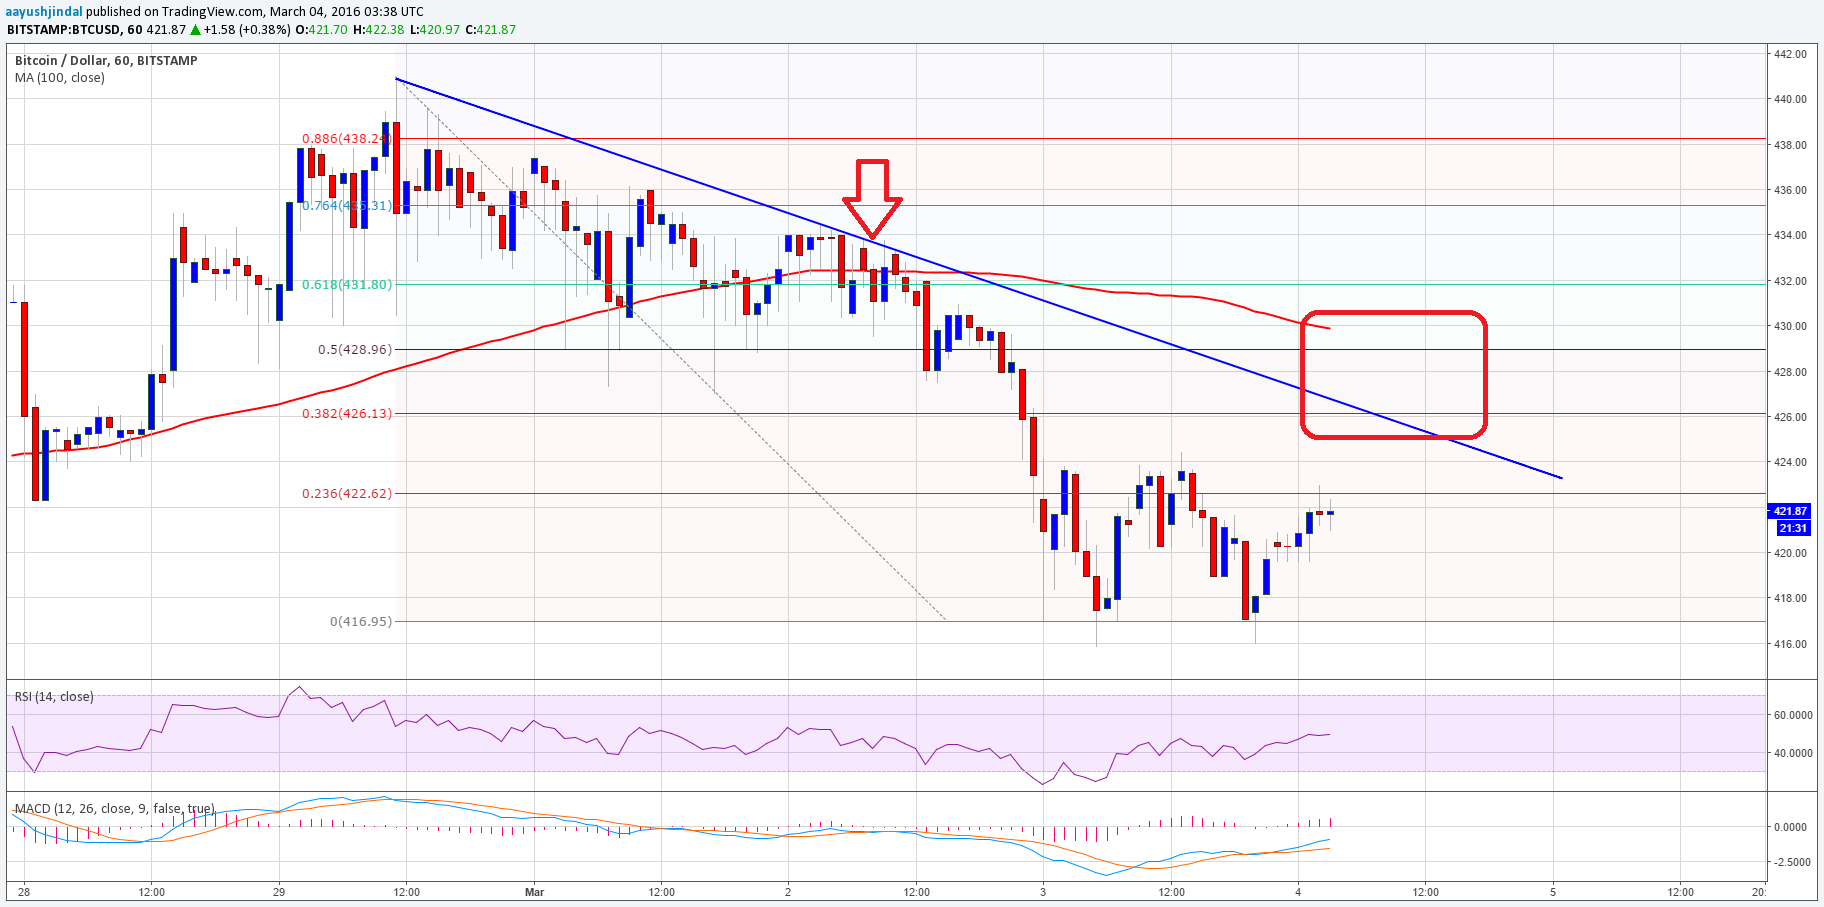
- Bitcoin price corrected a few points higher after collapsing, and yesterday’s sell idea worked.
- The price struggled to gain traction, and it looks like moving ahead, it won’t be easy for the bulls to take it higher.
- There is a bearish trend line forming on the hourly chart (data feed from Bitstamp), which may serve as a resistance zone moving ahead.
Bitcoin price failed to move higher as sellers remain in control. Now, can we look for more losses in the near term?
Bitcoin Price – Resistance Near Trend Line
Bitcoin price after trading as low as $416 attempted to move higher, but failed. The bulls failed to gain strength as rallies were prevented during the past couple of sessions. The price even failed to settle above the 23.6% Fib retracement level of the last leg down from the $440 high to $416 low.
There is a bearish trend line forming on the hourly chart (data feed from Bitstamp), which may be seen as a hurdle for the bulls if they attempt once again to take the price higher. The 38.2% Fib retracement level of the last leg down from the $440 high to $416 low is also positioned near the trend line resistance to stall the upside move. A break above the trend line resistance could take the price towards the 100 hourly simple moving average, which is another barrier for more gains.
On the downside, an initial support can be around the last low of $416. A break below it might call for a test of $400 in the short term.
Looking at the technical indicators:
Hourly MACD – The hourly MACD is in the bullish zone, meaning there is a chance of a minor move higher.
RSI (Relative Strength Index) – The hourly RSI is still below the 50 level, which may be a concern for the bulls.
Intraday Support Level – $416
Intraday Resistance Level – $428
Charts from Bitstamp; hosted by Trading View
