Key Highlights
- Ripple price after surging sharply above $0.008000 yesterday found sellers and started to move down.
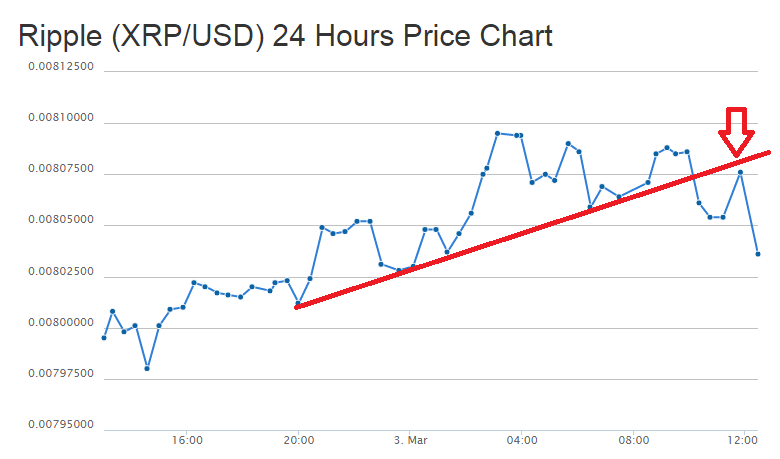
- There was a bullish trend line formed on the hourly chart of Ripple price (provided as CoinGecko), which was broken during the downside drift.
- More declines are possible in the near term if sellers take control and push the price down.
Ripple price looks like made a short term top and may correct a few points more before moving back higher.
Ripple Price – Trend Line as Resistance
Ripple price as highlighted yesterday climbed above $0.008000, but failed to retain momentum. There was a downside reaction intraday, taking the price back towards the stated level. The price before correcting down formed a new high of $0.008095. There was a bullish trend line formed on the hourly chart of Ripple price (provided as CoinGecko), which was cleared recently to open the doors for more losses.
One key point to note is the fact that the same broken trend line acted as a resistance for the bulls when they tried to take the price back higher. One positive for sellers is that the price already cleared the 23.6% Fib retracement level of the last leg from the $0.007980 low to $0.008095 high. So, there is a chance of more losses in the near term.
The next support on the downside can be at $0.008012 or near the 50% Fib retracement level of the last leg from the $0.007980 low to $0.008095 high. On the upside, a break above the $0.008075 level could take the price towards the last high or even $0.008100.
Looking at the indicators:
Hourly MACD – The MACD is back in the bearish zone, which is calling for a downside move.
Hourly RSI – The RSI is above the 50 level, which is a divergence sign for the bulls.
Intraday Support Level – $0.008012
Intraday Resistance Level – $0.008060
Charts Courtesy: Coingecko
