Key Highlights
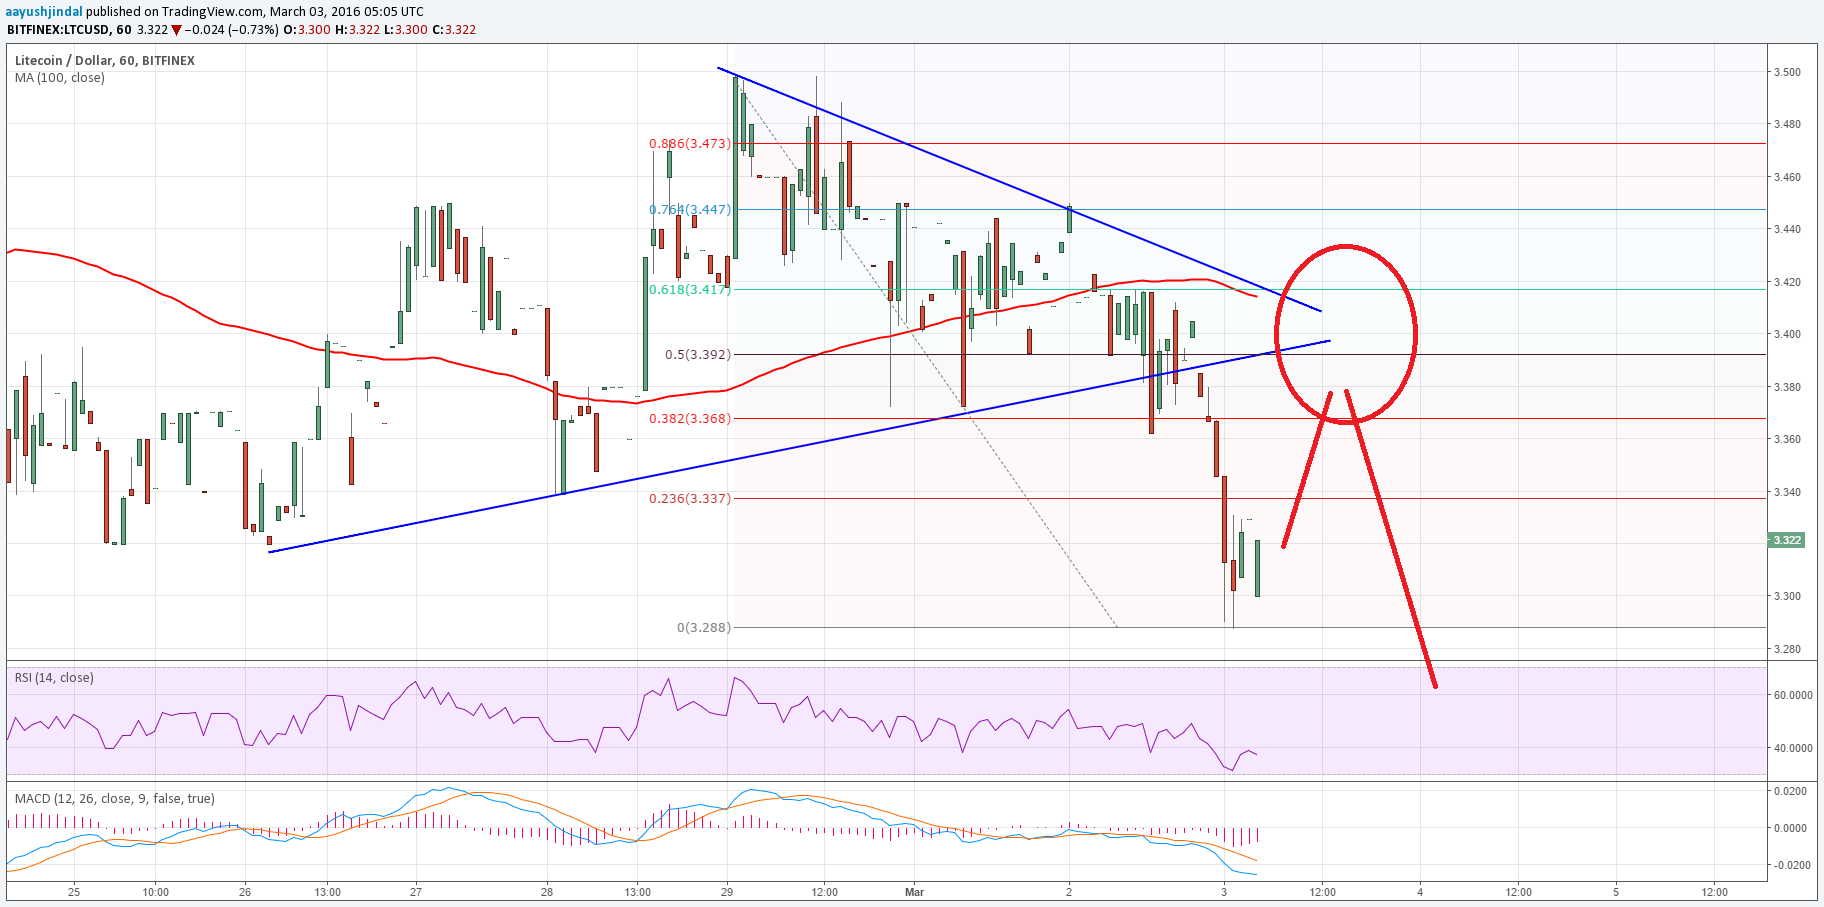
- Litecoin price after completing a consolidation pattern traded down, and moved towards the $3.30 level as forecasted in yesterday’s post.
- There was a break of a bullish trend line noted on the hourly chart with data feed from Bitfinex.
- The price may recover a few points from the current levels, but might face selling pressure on the upside.
Litecoin price traded down and settled below a major support area. It looks like more losses are on the cards moving ahead.
Sell More?
I highlighted in yesterday’s post that it will be wise to wait for a break in Litecoin price to enter a trade. And, if you followed the advice, then you might gained intraday. There was a break of a bullish trend line noted on the hourly chart with data feed from Bitfinex. The price moved down after the break and traded as low as $3.28. All in all the drop was very sharp and perfectly matched my view of waiting for a break.
Now the price is again stabilizing, which means there is a chance of a minor correction from the current levels. On the upside, an initial resistance can be around the 23.6% Fib retracement level of the last drop from the $3.49 high to $3.28 low. A break above it might push the price towards the broken trend line and support area, which might play a major role as it is also coinciding with the 50% Fib retracement level of the last drop from the $3.49 high to $3.28 low.
The most important resistance is around the 100 hourly simple moving average, where one might consider selling.
Looking at the indicators:
Hourly MACD – The MACD is in the bearish zone, suggesting sellers are in control.
Hourly RSI – The RSI is around the oversold area, calling a small correction.
Intraday Support Level (HitBTC) – $3.28
Intraday Resistance Level (HitBTC) – $3.35
Charts from Bitfinex; hosted by Trading View
